A critical component of the Institute for Housing Studies’ (IHS) applied research model includes technical assistance to community groups and custom data analysis that illustrates different factors behind changing neighborhood dynamics. These types of data can provide a greater understanding of the reasons behind neighborhood change, provide evidence that amplifies the day-to-day experiences of community members, and inform community-led conversations to identify priorities and strategies.
For nearly four years, IHS has supported the Greater Chatham Initiative (GCI) with comprehensive data and analysis to inform the deployment of GCI’s housing strategy in Chatham, Avalon Park, Auburn Gresham, and Greater Grand Crossing. This blog highlights some of this work and how it has been used by GCI. To explore previous blogs in this series, such as our recent post on our partnerships to build data to inform anti-displacement strategies in East Garfield Park, click here.
About the Greater Chatham Initiative
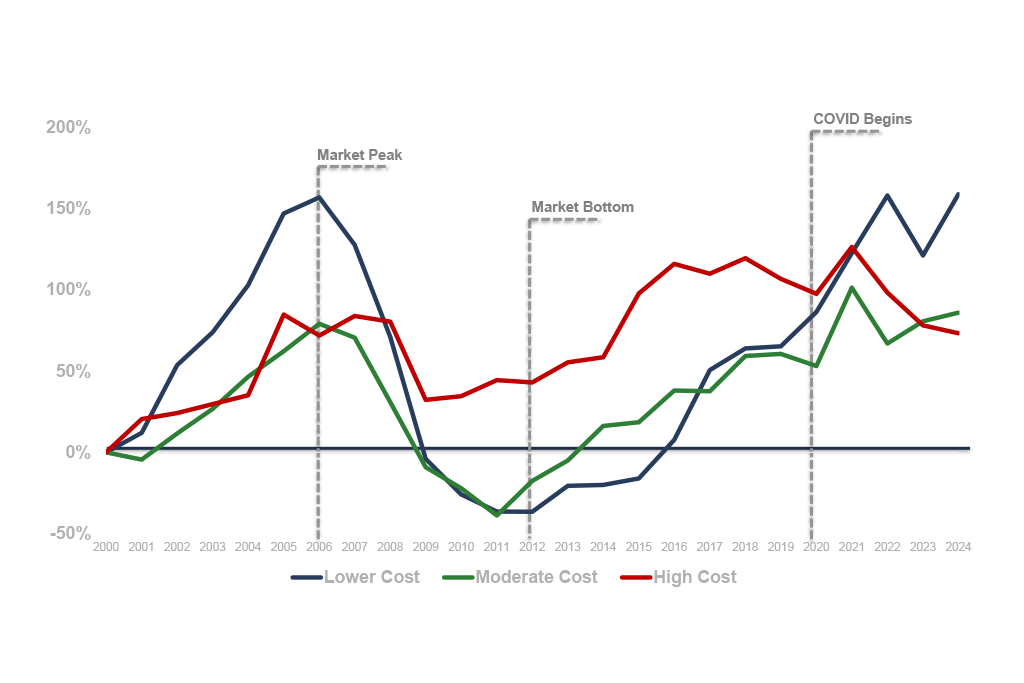
Since 2016, a significant community development effort has been underway in Greater Chatham. The Greater Chatham Initiative arose from a comprehensive strategic planning process with the goal of revitalizing Greater Chatham. Greater Chatham has historically been central to Chicago’s African American community and an important component of the Chicago’s group of middle neighborhoods. The community has been heavily hit by the foreclosure crisis and experienced recent shifts in households by income and age. As Figure 1 below shows, house price growth in Greater Chatham has lagged the City of Chicago average, but has also been more stable and the housing recovery more robust than other south side peers. Working to address the mix of challenges through the communities’ strengths and strategic advantages including level one schools, historic housing stock, and access to transportation and manufacturing districts have underpinned GCI’s effort. Across eight areas including housing, workforce, youth development, and civic capacity, GCI works with partner organizations to develop and implement strategies for Greater Chatham to re-emerge from the recession as a neighborhood of choice and opportunity.
Figure 1. Quarterly Single Family House Price Changes in Greater Chatham, South Side Peer Neighborhoods, and the City of Chicago, 1997 to 2018
Data and analysis to contextualize the market recovery
The Institute for Housing Studies was an early partner of GCI’s. Since 2016, IHS has provided ongoing data analysis to support GCI’s housing initiatives. Among other technical assistance work and custom data products, IHS has tracked trends in and characteristics of sales activity in Greater Chatham on an annual basis. These trends detail how the characteristics of sales vary among the neighborhoods making up the Greater Chatham community, both by the quantity and prices of sales and by market actors – investors or likely owner-occupants.
These data were created in response to key questions GCI had about the nature of demand for housing and the changing market in Greater Chatham. Where was the market functioning and where was it seemingly stuck? What role were investors playing in helping to stabilize Greater Chatham’s housing market?
Nedra Sims Fears, executive director of GCI, said this information was important for the organization to gain a better understanding of the housing market specific to the Greater Chatham area.
“Greater Chatham has 120,000 people and it’s in a 12 square mile area. Anyplace else it would be considered a mid-size city,” said Fears. “So, when you look at the averages of what’s going on in the city of Chicago, that is the backdrop, but it doesn’t tell you how particular neighborhoods are performing.”
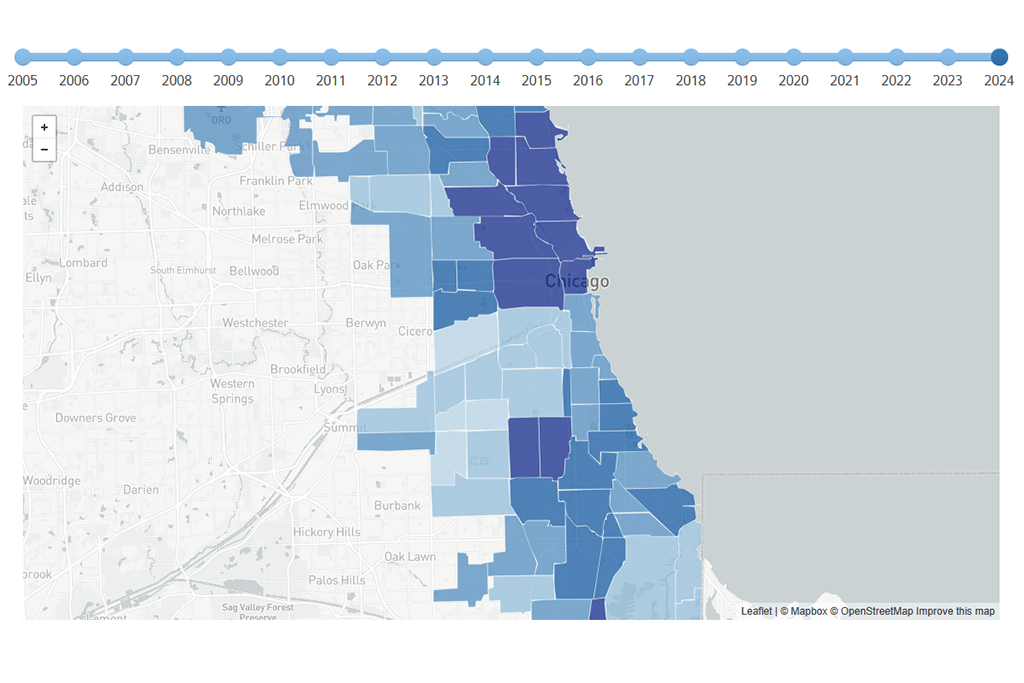
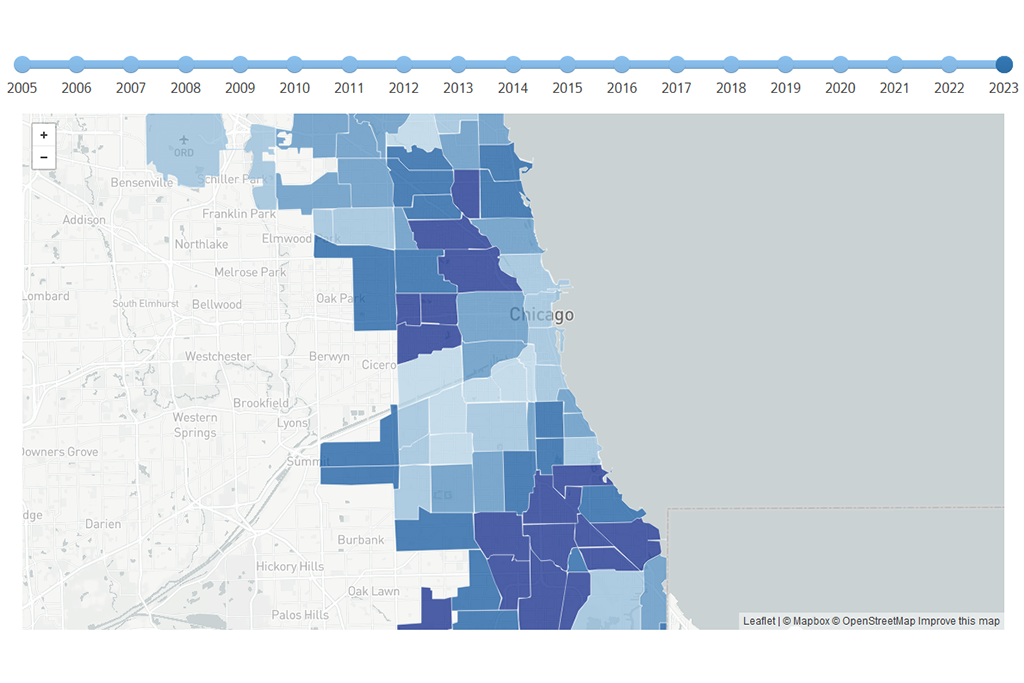
IHS’s first reports in 2016 showed a housing market where roughly 40 percent of all sales in Greater Chatham sold for less than $50,000. Many of these properties were foreclosure distressed and purchased by investors. Despite the drag of lower values on sales prices in the aggregate, interactive maps produced by IHS showed pockets of higher-priced sales and evidence of flipping activity driving higher price points in Avalon Park and Chatham (Figure 2). Fears said the data helped inform GCI’s investor strategy.
“The more we can get [investors] market information, we feel it can inform them so that they can make the right choices of investment. We also know that it helps shape their behavior,” she said.
Figure 2. Transactions in Greater Chatham interactive map, 2015 to 2018
Fears said that by showing investors the analysis that illustrated demand for higher-priced sales of likely-rehabbed properties, GCI was able to influence investment in this area of the market.
“By pushing that information out we’ve seen an increase in those types of rehabilitations when we shared with them both the kind of price points that those properties were getting, and also that they were on the market for a shorter period of time because they were giving the buyers what they wanted.”
Beginning in 2017 as the inventory of foreclosed properties and distressed sales dried up in Greater Chatham, IHS began to detect an increased share of sales between individual buyers and investors purchasing at higher price points – traditional activity that tends to dominate sales activity in neighborhoods with stronger real estate markets. Overall, these trends in the composition of sales activity began to lead to overall higher prices in all communities in Greater Chatham. Whereas 44.9 percent of all single-family sales activity sold for less than $50,000 in 2015, only 27.2 percent of sales were less than $50,000 in 2018 (Figure 3).
Figure 3. Share of Single-Family Sales in Greater Chatham, 2015 to 2018
As lower-value sales began to demonstrate smaller and smaller shares of activity, median sales prices started to increase in all of Greater Chatham’s communities. For example, the average single-family home in Greater Grand Crossing sold for $40,000 in 2015 and $60,000 in 2018, an increase of 50 percent.
GCI wanted to better understand the geographic concentrations of higher and lower-priced activity in Greater Chatham and to better communicate changes observed in Greater Chatham over time, so IHS developed a series of hot spot maps. These visualizations created in 2016 and 2018 illustrate the compelling story of neighborhood recovery in Greater Chatham – beginning first in pockets of Avalon Park and Chatham and in the western-most portion of Auburn Gresham in 2016 and amplification of these patterns in 2018 (Figures 4 and 5).
Figure 4. Hot Spot Analysis of Single-Family Sales Activity in Greater Chatham, 2016
Figure 5. Hot Spot Analysis of Single-Family Sales Activity in Greater Chatham, 2018
GCI works with several organizations, including Neighborhood Housing Services of Chicago, the Greater Auburn-Gresham Development Corporation, and the Cook County Land Bank. The data have helped GCI communicate the impact of their programs to partner organizations.
“We can talk about tactical activities that we’ve done like trolley tours, street activation events such as summer dining on 75th, known as Dining on the 5, or holiday window displays and activities, known as Kwanzaa on the 9, getting homeowners’ wills as poor heirship transfers account for a significant portion of our vacant homes, and getting information to potential buyers that we’ve educated,” said Fears, “but to actually see the traction, where and how many more people are moving into the area, what price points that they’re moving in - has been really informative.”
Visualizing the changing market has also helped GCI analyze unexpected changes in local market pressures and understand what areas are garnering more interest.
“Seeing the trends helps to solidify our perceptions that one area has more interest than others, and the numbers bear that out. Sometimes it surprises us - we didn’t expect that the northern Grand Crossing neighborhood has more demand,” said Fears. “We speculated that this was because there was more demand based on being next-door to Woodlawn and Englewood, and it had to do with the proximity to the potential [Obama Presidential Center] and [Tiger Woods South Shore & Jackson Park Golf Course]. Just the potential coming of a major new anchor can shift investor behavior.”
These data have helped GCI understand how the market context is changing and how interventions may need to shift to achieve program goals. The data have also helped the organization share reliable information to residents and investors and provide valuable data to communicate program outcomes.
“The partnership has been great in helping us kind of right-size the market information for a particular neighborhood,” said Fears. “It shows that people are hungry for neighborhood-specific data that has been vetted.”
For IHS, producing these reports in the context of GCI’s expert feedback and constant application to program strategies has helped the Institute refine and develop new indicators and analysis and increase our understanding of how nonprofits use data. These insights have benefited IHS’s other partnerships too, leading to innovations in data and technical assistance we have provided to the City of Chicago’s Micro-Market Recovery Program, Garfield Park Community Council, Logan Square Neighborhood Association, Southwest Organizing Project, and Neighborhood Housing Services.
Stay tuned for future examples of other IHS partnerships. Thanks, GCI!