This is the first post in a series that illustrates how to use housing market indicators data from the IHS Data Portal to explore trends and patterns in local housing markets within Cook County.
The IHS Data Portal is a tool that the Institute developed to further connect our work to local housing policymakers and practitioners and others interested in the changing dynamics of local housing markets. The IHS Data Portal makes available 16 housing market indicators from five core data sets in the IHS Data Clearinghouse. Data available include indicators related to the composition of the housing stock, characteristics of property sales, and mortgage, foreclosure, and completed foreclosure auction activity.
This post explores one of the subtypes available on the data portal for property sales: the share of sales purchased in cash. This data set is constructed by combining mortgage data with property sales data to determine whether a property purchase was financed with a mortgage or was purchased using cash. With these data, users can explore the growing share of cash sales and the geographic variation in cash buying versus financed activity in different City of Chicago community areas, aldermanic wards, in 127 Cook County municipalities, or for the Cook County region.
Background
IHS explored this same issue in our 2012 report Cash or Credit: The Role of Cash Buyers in Cook County’s Housing Market. The report found that between 2005 and 2011, residential sales activity declined substantially and that this trend was driven by a decline in sales financed with a mortgage. As a result, the share of Cook County’s property sales purchased in cash increased from less than 15 percent of sales in 2005 to 45 percent of sales in 2011. In the City of Chicago, cash sales activity increased from just over 15 percent of sales in 2005 to roughly 48 percent of sales in 2011. The analysis found that cash sales were heavily concentrated in substantially foreclosure-distressed communities throughout Cook County.
Cash sales are a valuable indicator for overall housing market health because high shares of cash activity demonstrate weak housing market conditions where housing prices are typically very low, demand for owner-occupied housing is weak, access to credit is limited, and investors are likely the most active buyers in the market. Conversely, an area where financed activity is high can indicate a strong housing market where: house prices are higher, the demand for owner-occupied housing is stronger, and mortgage credit is more available.
Using Data on Cash Sales from the IHS Data Portal
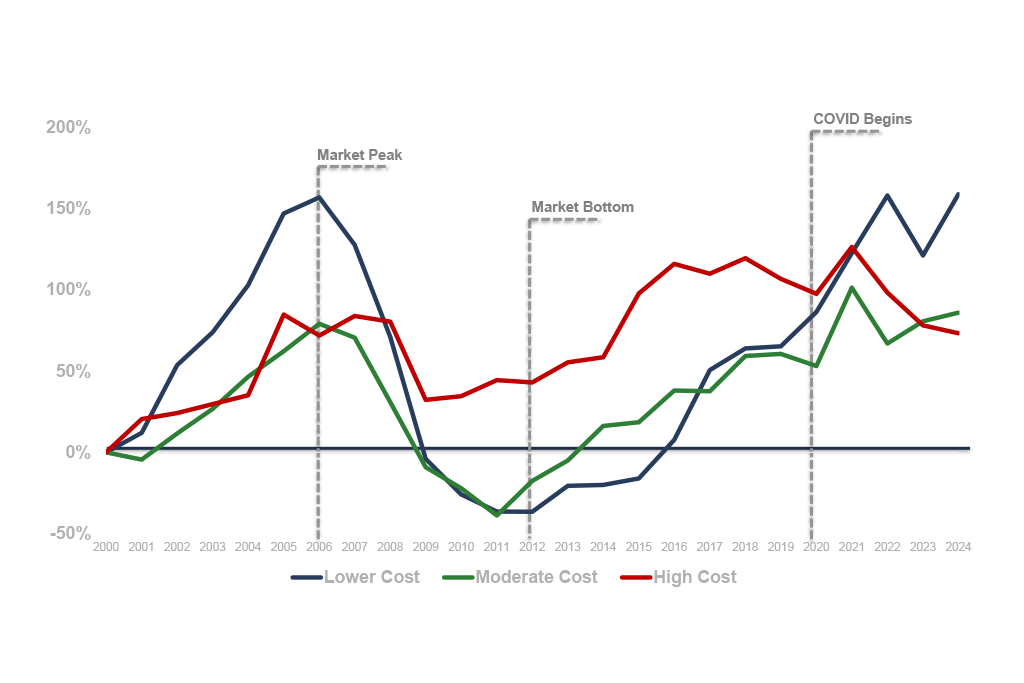
Using the IHS Data Portal, we downloaded data for the share of sales purchased in cash for the Cook County region from 2005 to 2012. The Cook County region includes data for six subregions of Cook County, including the City of Chicago. While the data is available broken out separately for single family homes, condominiums, two-to-four unit buildings, and for buildings with five or more units, Chart 1 below visualizes activity for all of these residential property types grouped together. Additionally, since the data is a share of total activity, we can use it to calculate the share of financed activity.
Chart 1 looks at how the role of financed and cash purchases has changed over time in the City. It highlights the citywide increase in the level of cash sales starting in 2007 and shows that since 2009, cash sales have represented just under half of all sales in Chicago. After a slight decline in cash sales between 2010 and 2011, this activity increased by .9 percent in 2012.
In addition to illustrating the level of cash buying activity, this indicator can also be used to analyze the level of purchases financed with a mortgage. Another way to interpret the data in Chart 1 would be to say that just over half the sales in City between 2009 and 2012 were financed with a mortgage.
 Share of Sales that were Financed with a Mortgage or Purchased Using Cash, 2005-12
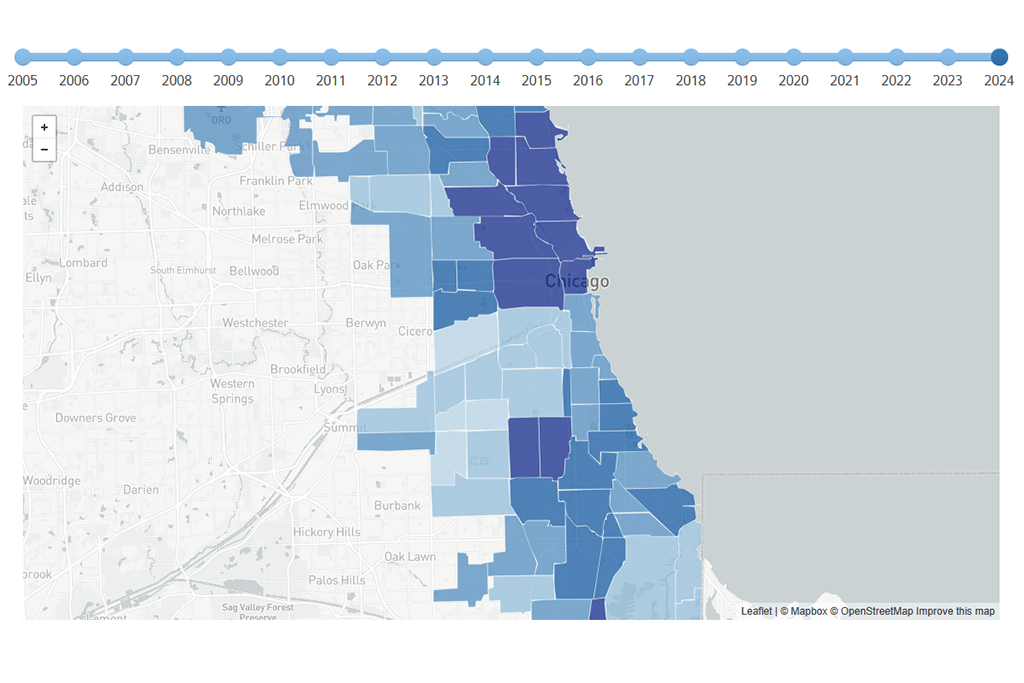
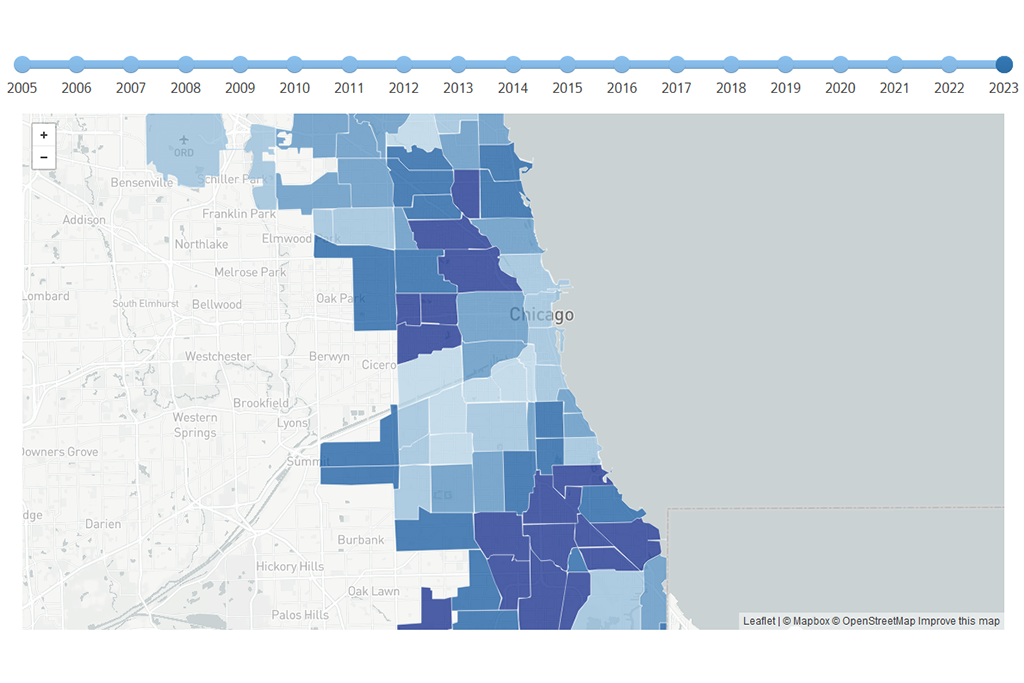
In Map 1 below, we look at the variation in levels of financed purchases in 2012 by City of Chicago Community Area. Instead of selecting Cook County region as the geography in the IHS Data Portal, we pulled these same data down by City of Chicago Community Area and brought it into GIS mapping software to visualize it spatially.
 Share of 2012 Property Sales that were Financed with a Mortgage, City of Chicago Community Areas
Map 1 shows that there is substantial geographic variation in the level of financed purchases in the City of Chicago. While roughly 51 percent of sales in 2012 were financed with a mortgage, in certain strong markets concentrated on the City’s North Side these sales represent significantly higher shares of total sales activity. For example, financed purchases represented over 70 percent of sales in strong markets including West Town, Lincoln Park, Lincoln Square, and North Center on the City’s North Side and in Beverly and Mount Greenwood on the City’s Southwest Side.
Meanwhile, in significant swaths of the City heavily impacted by the foreclosure crisis, financed sales continued to significantly lag behind levels seen citywide in 2012. In the majority of Community Areas on the South and West sides of the City, financed purchases in 2012 accounted for less than or equal to 30 percent of total sales activity. This of course means that levels of cash purchases were at or exceeded 70 percent of total sales in these same communities.
Users can explore other data sets available on the IHS Data Portal to see what’s driving high levels of financed or cash purchases in different communities. For example, data on the share of sales that were distressed in a given year or geography, as well as cumulative foreclosure filings and completed foreclosure auctions data, can help to illustrate the relationship between foreclosure activity and cash sales in these communities.
Look to the IHS blog for upcoming posts exploring data available on the new IHS Data Portal.
To be notified about new blog posts and to give us feedback, follow us on twitter, like us on Facebook, or join our LinkedIn Group.