This blog updates data on house price trends in City of Chicago neighborhoods based on the neighborhood’s race and ethnic composition. These indicators were originally released as part of IHS’s 2021 report Data and Research to Facilitate Equitable Homeownership in Chicago, a collaborative report with the Urban Institute. That report highlighted key data meant to inform the development and implementation of local strategies to expand access to homeownership and wealth-building opportunities for Black and Hispanic households, protect current homeowners of color, and preserve the existing affordable housing stock in Chicago.
The analysis uses data from IHS’s Cook County House Price Index, now updated through the second quarter of 2022, as well as data from the American Community Survey on the race and ethnic composition of census tracts. The IHS House Price Index tracks quarterly changes in house prices, benchmarking these changes to price levels in 2000 through the second quarter of 2022.
The new data show that single-family house prices increased dramatically after 2020, particularly in predominately Black and majority Hispanic/Latino neighborhoods. Rising prices during the pandemic have helped prices to finally recover from the decades-old impact of the Great Recession in Black communities where house prices fell 60.3 percent from 2007 to 2012 and were still 24 percent below pre-recession peaks at the end of 2020. In majority Hispanic/Latino and majority non-white communities, house prices have also grown and have seen the largest longer-term price gains in the city. For many community development practitioners, price gains in Chicago's communities of color are a welcomed and positive story and a response to substantial efforts to rebuild demand and stabilize communities that had been disproportionately devastated by the foreclosure crisis. Conversely, rapid price gains also raise questions about the importance of maintaining affordability, mitigating displacement pressures, and working to ensure that price gains build wealth for the community.
Discussion
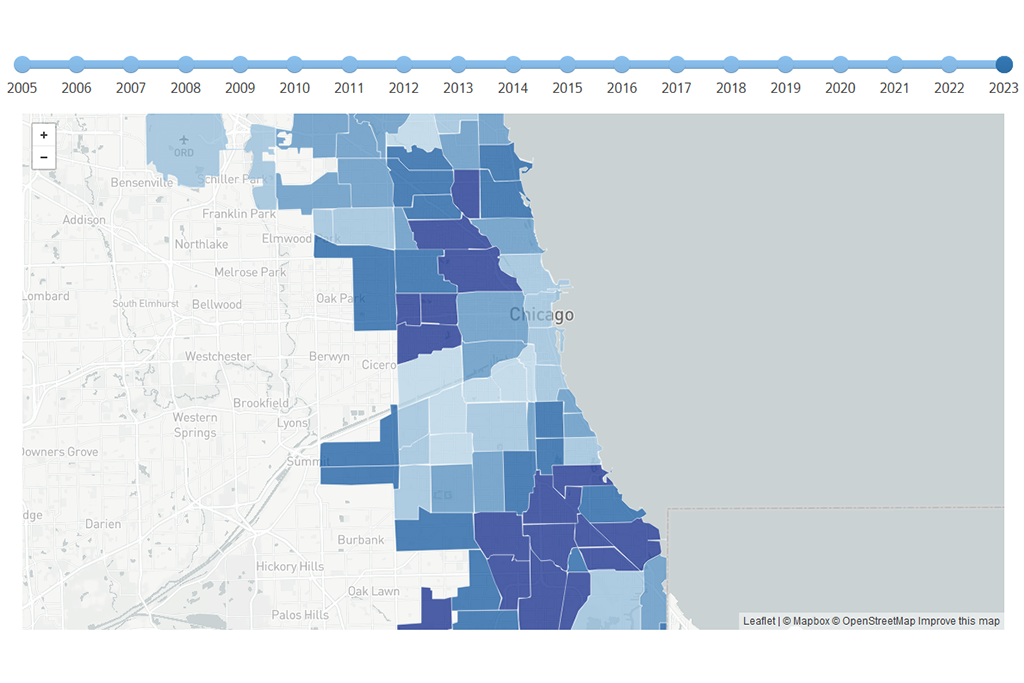
Understanding price trends and how they vary across neighborhoods can help housing and community development practitioners and community stakeholders track the changing dynamics of housing demand, flag areas with potential emerging affordability pressures, and identify communities in need of additional investment. The map below shows Chicago census tracts segmented by the underlying racial and ethnic composition of the population. Tracts are categorized as at least 80 percent Black, majority Hispanic or Latino, majority non-white, or majority white. Figure 2 tracks quarterly single-family house price changes from 2000 through the second quarter of 2022 in Chicago neighborhoods based on this mapped neighborhood race and ethnicity typology. Figure 3 highlights key house price metrics. Click here to download the summary table, quarterly indexed data, and annual sample size information.
Figure 1. City of Chicago Census Tracts by Neighborhood Racial or Ethnic Typology, 2019
Figure 2. IHS House Price Index by City of Chicago Neighborhood Racial or EthnicTypology, 2000 to 2Q 2022
Figure 3. Key IHS House Price Index Metrics by City of Chicago Neighborhood Racial or EthnicTypology, 2000 to 2Q 2022
As illustrated by Figure 2, single-family home prices in predominantly Black neighborhoods were hit hard during the Great Recession, dropping substantially from their peak in 2007 until hitting the bottom of the market in 2012. After 2012, prices in these neighborhoods had a much slower recovery than neighborhoods with different racial or ethnic makeups, significantly lagging behind price growth in other parts of Chicago between 2012 and 2019. However, since the beginning of the COVID-19 pandemic, prices in Chicago’s predominantly Black neighborhoods have grown the fastest with price levels increasing by 56 percent between the first quarter of 2020 and the second quarter of 2022. The next largest gains were in Chicago’s majority Hispanic/Latino communities which increased by 31.1 percent since the beginning of the pandemic.
This rapid price appreciation has several implications for homeowners in these communities. Figure 4 charts house price changes from pre-Great Recession peak levels compared to the second quarter of 2022. It indicates that as of the second quarter of 2022, prices in predominantly Black neighborhoods surpassed pre-Great Recession peak levels and were 4.3 percent higher than at any other point since 2000. This is an important benchmark for homeowners who may have purchased their homes or refinanced their mortgages during those peak, pre-Great Recession years. As prices continue to appreciate, these owners will have increased home equity and are less likely to be underwater on their mortgages. Higher levels of underwater homeowners impact inventory and wealth and can impede a normally functioning real estate market.
Figure 4. House Price Changes from Pre-Great Recession Peaks to 2Q 2022 by City of Chicago Neighborhood Racial or EthnicTypology
Recent pandemic-period price growth also means that long-term homeowners have an increased ability to realize wealth gains through property value appreciation. Tracking price changes since 2000 is a key indicator that helps stakeholders understand the implications of an uneven housing recovery on long-term homeowners. Increasing home equity over time is one of the ways that both lower- and higher-income households build wealth. However, in areas where there has been limited long-term price appreciation, long-time owners benefit less from increasing home equity compared to those in areas with significant appreciation. Additionally, equity gains are racially skewed due to the disparate impact of the foreclosure crisis in predominately Black and majority Hispanic/Latino census tracts. Over 39 percent of properties in predominately Black census tracts and nearly 28 percent of properties in majority Hispanic/Latino census tracts had at least one foreclosure during the Great Recession and recovery period, compared to just under 10 percent of properties in majority-white neighborhoods. This disparity means that fewer longer-term owners in predominantly Black and majority Hispanic/Latino communities are likely to benefit from these recent equity gains than in majority-white neighborhoods. Additionally, investor activity in predominately Black communities reached over 40 percent of sales after 2012, meaning investors, rather than homeowners, are likely to be the primary beneficiary of recent price appreciation in these communities.
Figure 5 shows how single-family house prices have changed in Chicago census tracts based on the racial and ethnic composition of the tract, and Figure 6 uses these price gains to estimate the potential home equity generated through price appreciation for buyers who purchased their homes in 2000. Over this period of time, Chicago’s majority Hispanic/Latino areas have seen the strongest long-term price growth when comparing price changes between 2000 and the first half of 2022, followed by majority non-white communities. Predominately Black and majority-white census tracts have seen the weakest long-term price growth, where house prices have increased by 119.8 percent and 122.3 percent, respectively.
Figure 6 shows that despite the similarities in house price changes in these two types of communities, there are massive disparities in how price changes translate to actual single-family house prices and estimated equity gains. For example, the average single-family home in a predominately Black community sold for $75,000 in 2000, appreciating 119.8 percent to an estimated $164,870 by the second quarter of 2022. By comparison, the average home in a majority white neighborhood sold for $237,000 in 2000 and has appreciated to $526,965. The gain in majority-white neighborhoods was $289,965 compared to $89,870 in predominately Black neighborhoods, illustrating the large gap in wealth acquired from increasing home equity. While these housing wealth gaps remain among Chicago's neighborhoods, pandemic-era price growth has helped narrow these gaps and these data highlight the opportunity for long-term owners to potentially benefit from this new home equity.
Figure 5. House Price Changes from 2000 to 2Q 2022 by City of Chicago Neighborhood Racial or EthnicTypology
Figure 6. Median House Prices in 2000 to Second Quarter 2022 and Estimated Equity Gain by City of Chicago Neighborhood Racial or EthnicTypology
While these are promising indicators, challenges remain. Recent data show that while homeownership rates have increased for Black households, they remain far below levels observed for white, Asian, and Hispanic or Latino households and are still lower than levels seen for Black households in 2010. Additionally, despite strong recent price growth, these data illustrate that house prices in predominantly Black communities remain below those seen in other parts of Chicago. While this gap highlights the potential for affordable homeownership options in Black communities, it also reflects the legacy and long-lasting impacts of historic and ongoing disinvestment patterns. In both Black and majority Hispanic/Latino areas, the data highlights potential wealth gains for long-term owners but also points to potential affordability pressures or gentrification concerns, raising questions about who is benefiting from price appreciation.
Going forward, it will be important to monitor the potential impact that rising interest rates and slowing housing market activity have on house price trends in Chicago neighborhoods. Continue to follow IHS’s work for future data updates related to creating and preserving homeownership and mitigating displacement pressure in Chicago, the preservation of affordable rental housing, and supporting equitable investment.
IHS's work on this topic is generously funded by the Chicago Community Trust, the John D. and Catherine T. MacArthur Foundation, and the Polk Bros Foundation.