This is the second post in a series that illustrates how to use the IHS Housing Market Indicators Data Portal to explore trends and patterns in local housing markets within Cook County. The first post in this series explored how to use the Data Portal’s property sales data set. This post uses a different data set available on the Data Portal to explore trends and patterns in mortgage lending activity in Cook County and the City of Chicago.
With this data set, users can explore the flow of mortgage credit into an area and see how it varies across geographies, by property type, and over time. While mortgages are often associated with home purchase, IHS’s mortgage data captures all originated mortgages secured by real estate: those for home purchase, refinance, home improvement, or an equity line of credit. In this post, we’ll explore the change in mortgage activity by Cook County subregion between 2005 and 2012, as well as the change in mortgage activity by property type in the City of Chicago during the same period.
Background
Mortgage activity is a valuable indicator for overall housing market health because, in the current mortgage environment, high levels of mortgage activity demonstrate strong housing market conditions where lending institutions are willing to finance the acquisition and rehabilitation of homes as well as give homeowners the ability to refinance their existing mortgages at lower interest rates. This was not necessarily the case from 2005 to 2007, where high levels of subprime lending were a negative indicator of community stability. With the collapse of the subprime market, access to credit tightened and mortgage lending, particularly home purchase lending, declined dramatically in Cook County.
Using Data on Mortgage Activity from the IHS Data Portal
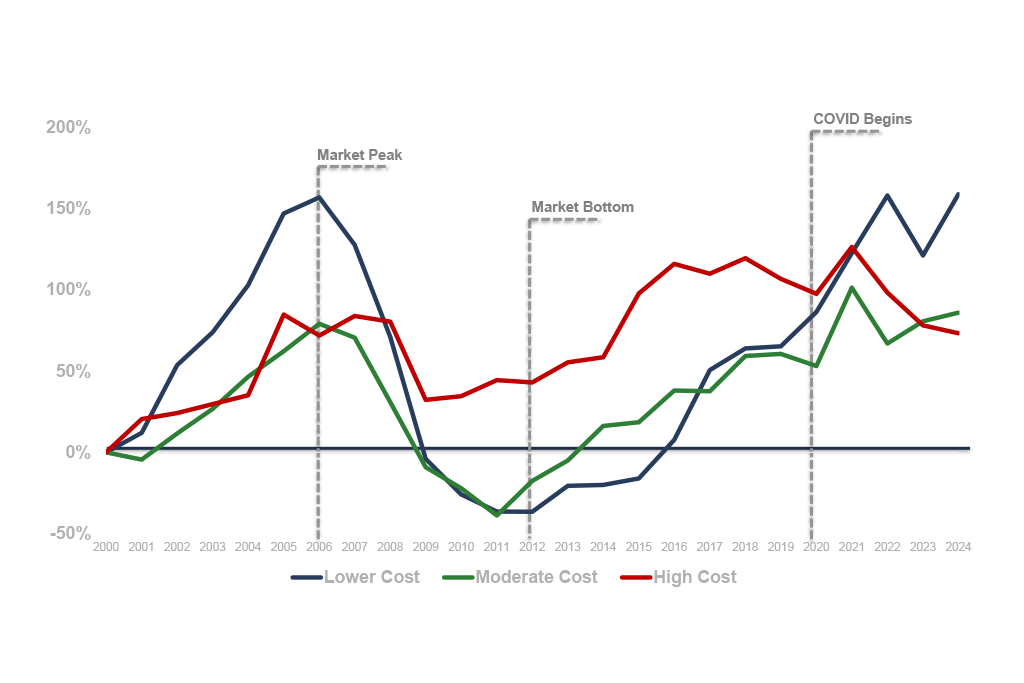
Using the IHS Housing Market Indicators Data Portal, we downloaded mortgages per 100 residential parcels for the Cook County region between 2005 and 2012. The Cook County region includes data for six subregions of Cook County, including the City of Chicago. Figure 1 visualizes the change in level of mortgage activity by Cook County subregion between 2005 and 2012.
 Figure 1. Mortgages per 100 Residential Parcels by Cook County Region, 2005 to 2012
Figure 1 shows that mortgage activity declined sharply in all regions of Cook County after 2006 with the onset of the housing crisis. The City of Chicago and South Cook County saw the most dramatic declines in mortgage activity. Many communities in these markets were heavily targeted by subprime lenders during the housing boom. The collapse of the subprime market and subsequent years of concentrated, high levels of foreclosure activity contribute to the declines in mortgage activity shown in Figure 1.
Figure 1 also shows that between 2011 and 2012, levels of mortgage activity have increased in every subregion of Cook County. As home sales financed with a mortgage remained relatively flat between 2011 and 2012, increases in mortgage activity shown in Figure 1 are likely a result of homeowners refinancing existing mortgages to take advantage of historically low interest rates.
Figure 2, below, takes a closer look at how the distribution of mortgage activity among different property types has changed within the City of Chicago during this same time period. To do this, we downloaded data for total mortgage activity by subregion for 2005 to 2012 and then isolated data for just the City of Chicago. Then we calculated the share of total loans in the City that were originated to buildings in four primary property types: single family homes, condominium units, small multifamily two-to-four unit rental buildings, and larger multifamily rental buildings with five or more units.
 Figure 2. Mortgages per 100 Residential Parcels by Cook County Region, 2005 to 2012
Figure 2 illustrates how the distribution of mortgage credit to different property types has changed between 2005 and 2012. While the share of total mortgages to single family homes and large multifamily buildings with five or more units in the City remained relatively unchanged from 2005 to 2012, smaller multifamily buildings with two to four units and condominiums saw the biggest changes in loan levels. In 2005, mortgages for two-to-four unit buildings accounted for more than 20 percent of total mortgage activity in Chicago, but by 2012, mortgages for two-to-four unit buildings declined to just less than 12 percent of all City of Chicago mortgages. At the same time, condominium units saw their overall share of mortgage loans increase from roughly 37 percent in 2005 to nearly 50 percent in 2012.
This shift in mortgage lending by property type is likely related to the concentrations of these property types within specific neighborhoods in the City. Two-to-four unit buildings make up a critical portion of the City’s rental housing stock, but a high percentage of these types of properties are concentrated in lower-income areas that have been hit hard by foreclosures and where levels of mortgage lending are lower. Conversely, condominium units are concentrated in higher income areas around the Loop and along Lake Michigan. These areas tend to have more stable real estate markets that where lending levels, while down, have been less impacted by the housing crisis.
In our next post in this series, we’ll take a closer look at the housing stock composition data set available on the Data Portal and show how this data set allows users to apply the 16 indicators available on the Data Portal based on the variation or concentration of property types in specific neighborhoods.
To be notified about new blog posts and to give us feedback, follow us on Twitter, like us on Facebook, or join our LinkedIn Group.