The newest release of the State of Rental Housing in Cook County updates key data on changing rental demand, the supply of rental housing, and how these dynamics are affecting access to affordable rental housing for Cook County's lowest income households. The report focuses on conditions in 2014, roughly two years into Cook County's housing market recovery, and compares data to pre-recession conditions in 2007 and conditions during the recession in 2011.
For information on data sources and methodology, click here. To access the data behind the figures in the report, click here. For more on how these data connect to local and national housing and community development policy issues, see the new affordability series on the IHS blog.
Key trends in rental demand:
Rental demand continues to rise
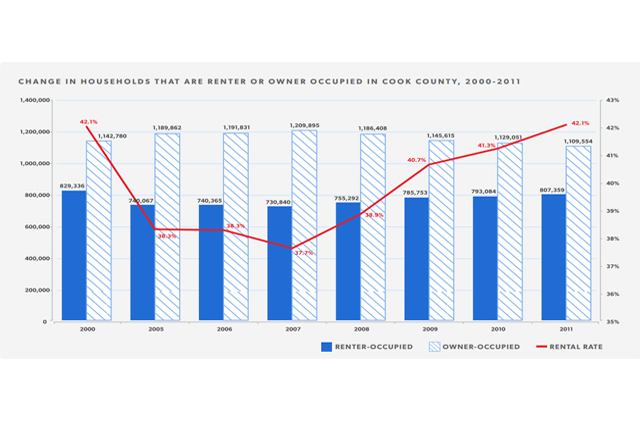
Mirroring national trends, the share of Cook County households that rent continues to rise. According to the Joint Center for Housing Studies, renter demand is at a 20-year high with 35.5 percent of households in the US renting in 2014. The charts below show the change in the share of Cook County households that were renters between 2000 and 2014 and the number of households that rented or owned during this same period. Between 2011 and 2014, Cook County saw an increase of almost 39,000 renter households, and 43.7 percent of all households in 2014 were renters. While the rate of this increase slowed after 2011, this increase represents an additional 115,000 renter households since 2007. During the same period, owner-occupied households declined by over 118,000.
The biggest recent rise in renters has been among higher-income households
A growing share of higher-income households is renting. The charts below show the number of renter households in each income group in 2007, 2011 and 2014 as well as the composition of all renter households by income group during this period. Nearly 60 percent of the increase in Cook County renter households between 2011 and 2014 was from higher-income renters earning between 120 and 200 percent of the area median income (AMI), or roughly an income range of $74,000 to $123,000 in 2014.
Despite this increase, the largest share (28.5 percent) of Cook County renter households earned less than 30 percent AMI in 2014, or an income of less than $18,479.
Younger households are driving rental growth
Cook County renter households are increasingly younger. The charts below show the number of renter households in each age group (determined by the age of the head of household) in 2007, 2011 and 2014 as well as the composition of renter households by age during this same period. Adults aged 25 to 34 saw the largest increase in renter households between 2011 and 2014, gaining 16,333 households during this period. This group grew by 75,753 households between 2007 and 2014. In 2007, this age group represented 25.7 percent of Cook County renters. By 2014, it had grown to roughly 31 percent.
Younger and higher-income renter households are the fastest growing market segment
When looking at both age and income of renter households, the largest growth occurred among young households earning high incomes. The charts below look at changes in the number and composition of renter households in 2007, 2011 and 2014 by age and income group. Nearly 28,000 more households headed by 25- to 34-year-olds earning between 120 and 200 percent AMI rented in 2014 than in 2007. In 2014, the most common renter was young (25-34) and either very poor or wealthy. For example, 6.4 percent of all renter households were aged 25-34 and earned 120-200 percent of AMI in 2014, and 6 percent earned less than 30 percent of AMI.
Key trends in rental supply:
Cook County’s rental stock is increasingly in single-family homes and larger rental buildings
The chart* below shows the composition of the rental stock by building size in 2007, 2011 and 2014. Following recent local and national trends in single-family rentals and investment and development of larger multifamily buildings, the chart shows that the share of rental units in buildings with 50 or more units increased from 18.6 percent to 19.1 percent of the stock between 2007 and 2014 while the share of rental units that are in single-family homes increased from 11.5 to 14.6 percent over the same period. Although single-family homes represent an increasing share of total rental units in Cook County, units in these properties still represent a relatively smaller share of total rental units than nationally. According to the most recent American Community Survey, roughly 35 percent of the nation's rental stock is in single-family homes.
Meanwhile, the share of rental units in two-to-four unit buildings has been shrinking. In 2007, rentals in two-to-four unit buildings were the most common in Cook County representing nearly 36 percent of the total. By 2014, this number had shrunk to just over 31 percent of the total. The reduced role of two-to-four unit buildings can be attributed to the growth of rental units in other types of buildings, but also high levels of foreclosure that left many two-to-four unit buildings deteriorated and vacant and the increasing popularity of converting these properties to single-family homes in many strong city neighborhoods.
Key trends in rental affordability:
Rental housing affordability remains a challenge
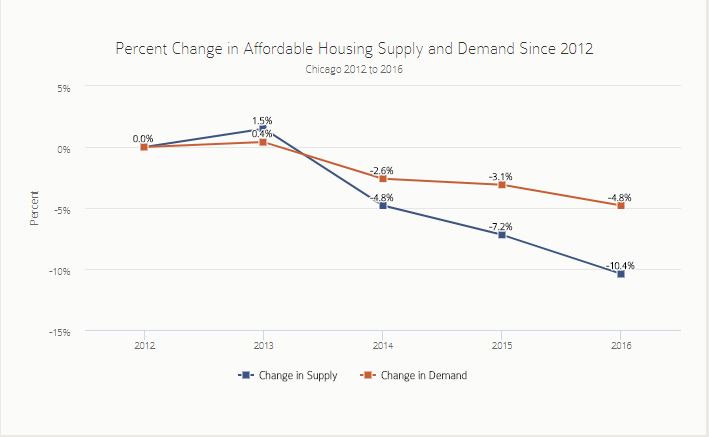
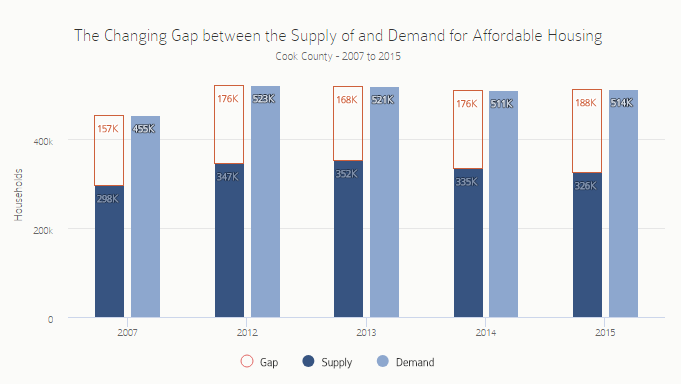
The recession and housing crisis led to a sharp rise in demand for affordable rental housing in Cook County. This increase in demand led to a growing “affordability gap,” or the difference between the demand for affordable rental housing by lower-income households and the supply of units that would be affordable at 30 percent of their income.
The chart* below examines levels of affordable rental demand and supply and highlights the pre-recession affordability gap in 2007, and annually during the recovery period 2011-2014. It shows that while narrowing slightly between 2011 and 2013, the affordability gap again grew in 2014 and is still a pressing issue in Cook County. After ballooning to nearly 178,000 units during the housing crisis in 2011 and remaining relatively stable throughout 2012, Cook County's affordability gap declined to 168,298 units along with improvements in the local economy and slight growth in affordable units in 2013. In 2014, the affordability gap again increased to roughly 176,000 units as the local housing market stabilized and property values and rents began to increase, but lower income households continued to struggle.
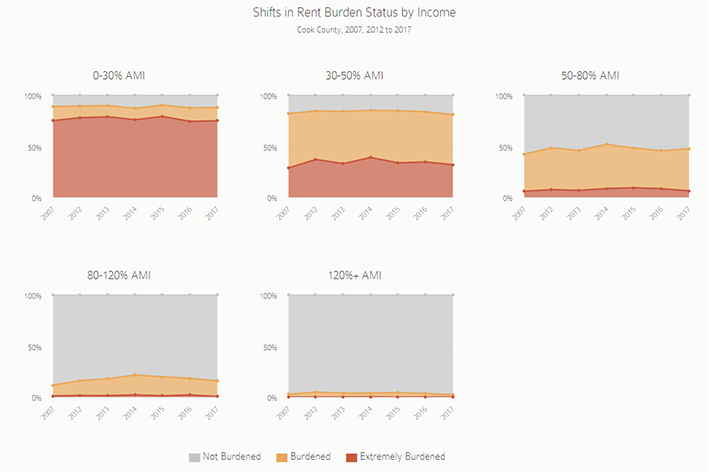
Growing numbers of low-income households are extremely rent-burdened
The persistence of the affordability gap has meant that many Cook County households remain rent burdened. Cook County has a higher share of rent burdened households than the country as a whole. Countywide over 52 percent of renter households paid 30 percent or more of their income towards housing in 2014 compared to 49 percent of households nationally. The chart below shows the rent burden status of Cook County households by income level in 2007, 2011 and 2014. Levels of rent burdened households were highest for renters with the lowest incomes. Over 85 percent of households earning less than half of the area median income were rent burdened in 2014. Compared to 2011, levels of rent burden were relatively flat for most income groups, but there were slight increases for moderate- and middle-income renters earning between 50 and 120 percent of the area median.
Additionally, severe rent burden (the number of households paying 50 percent or more of their income towards rent) has increased for low-income households earning 30-50 percent of the area median (between $18,500 and $31,300 in 2014). Since 2007, the share of these low-income renter households experiencing severe rent burden increased from nearly 29 percent to 39 percent. This 10 percentage point increase represents an increase of over 17,000 low-income renter households.
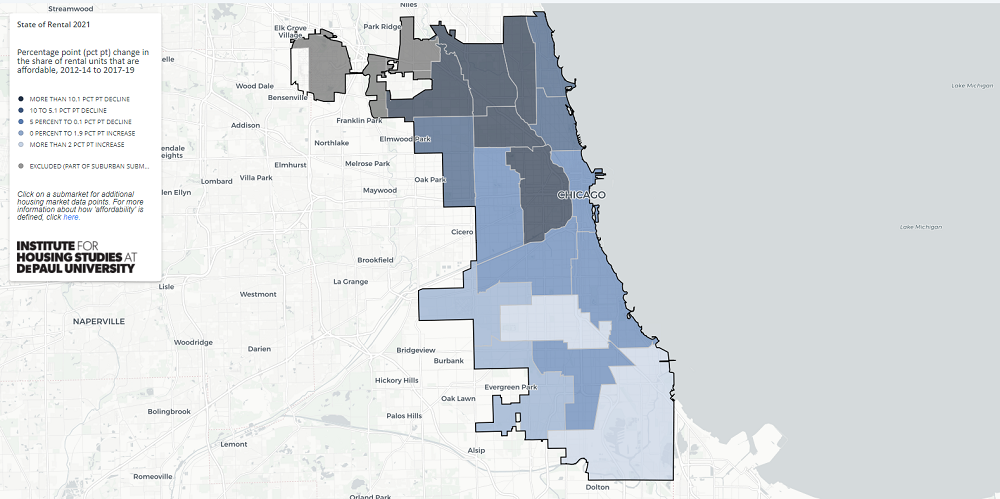
The affordability gap is highest in areas with high concentrations of low-income households
The interactive map below illustrates the variation in the gap between the demand for and supply of affordable rental housing for 34 submarkets in Cook County. Areas with large affordability gaps are those where substantial numbers of low-income households are rent burdened, paying more than 30 percent of their income towards rent.
The map shows that the submarket with the largest affordability gap is on the south side of Chicago along Lake Michigan and includes community areas such as Hyde Park, South Shore, Woodlawn, and Washington Park. While this area has the largest number of affordable units in Cook County (over 34,000 units), it also has the most demand for affordable rental housing from low-income households (47,500 households). Other areas with substantial affordability gaps include the west side submarket covering Humboldt Park, East/West Garfield Park, and North/South Lawndale and the north side submarket which includes Uptown and Rogers Park. To access a full screen version of the map, click here.
*Data and charts for supply and affordability were corrected by IHS in February, 2017