The First Quarter 2013 IHS Cook County House Price Index reflects house price changes on properties with repeat sales from the first quarter of 1997 through the first quarter of 2013. The IHS House Price Index tracks quarterly price changes for the four primary residential property types found in the County: single family homes, condominium units, small rental buildings with two-to-four units, and larger rental buildings with five or more units. This release of the Index also breaks out Cook County house price changes for properties in low-, middle-, and high-value tiers.
For a detailed description of the IHS Cook County House Price Index and how price tiers are calculated, click here. For each release of the Index, tabular data is available for download.
Data from the first quarter of 2013 show that prices for single family homes saw slight increases year-over-year and quarter-over-quarter. Condominium units continue to be the weakest segment of the housing market but saw slight increases between the fourth quarter 2012 and the first quarter 2013. At the same time, small rental buildings with two-to-four units saw the strongest recent price increase trends. Larger multifamily properties experienced a third consecutive quarter of price declines, pushing prices down more than 11 percent year-over-year. Looking at price changes by home-value tier, the highest-value properties across all property types have seen the strongest recent price increases and retained the most value gained since 2000.
Key Trends from First Quarter 2013:
Single family homes
-
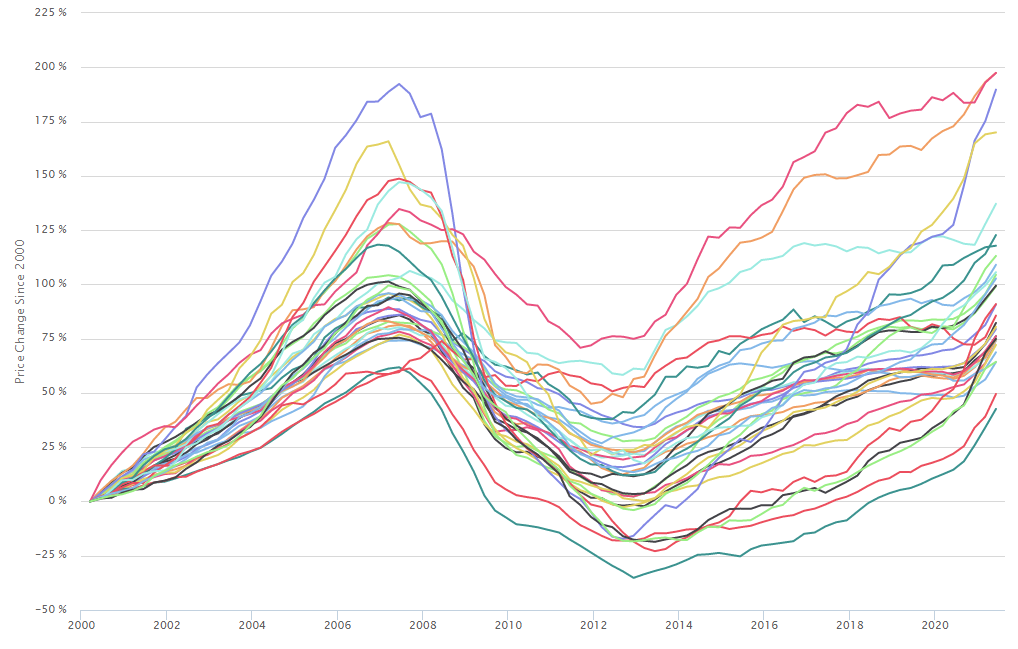
Prices of single family homes remain relatively flat. Single family homes in Cook County continue to exhibit weak price growth. The IHS House Price Index shows that prices for single family homes increased slightly year-over-year in the first quarter of 2013 by 3.5 percent when compared to the first quarter of 2012 (see Figure 1 for full price trend). Compared to the fourth quarter of 2012, single family home prices increased by 3.2 percent. From their peak in 2006, prices of single family homes were down nearly 38 percent as of the fourth quarter 2012 (see Figure 2 for cumulative annual price change).
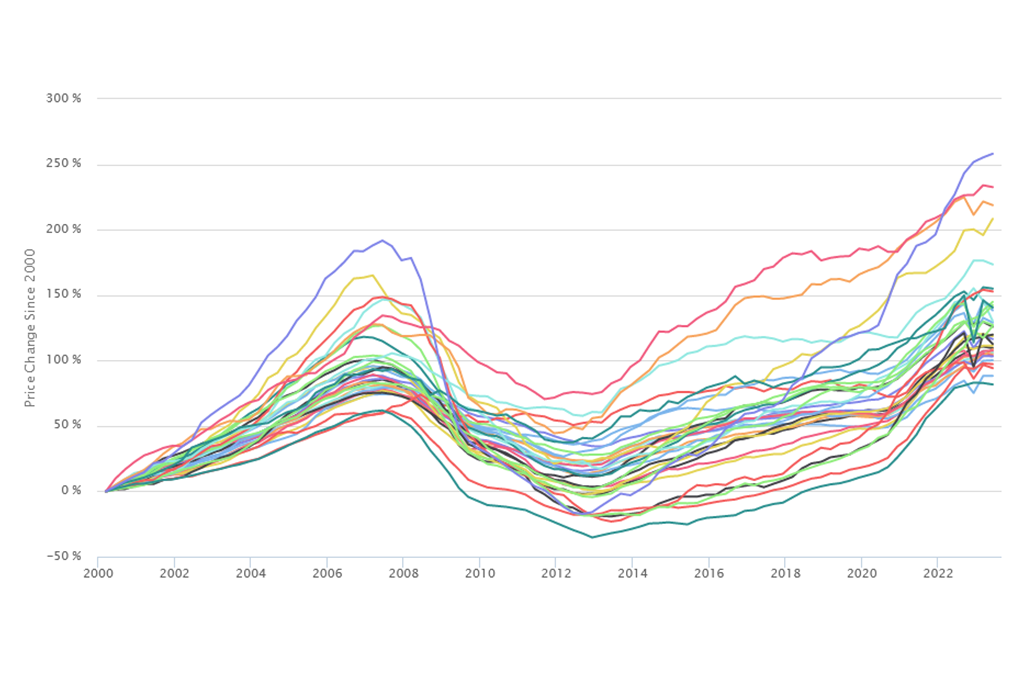
 Figure 1. Cook County Price Changes by Property Type, 1997 to First Quarter 2013
Condominiums
-
After nearly two years of consistent price declines, condominiums show momentary price stability. The condominium market in Cook County remained the weakest segment of the County’s housing market, but showed a small sign of recent improvement. In the first quarter of 2013, condominium prices were down more than five percent year over year, but did show a quarter-over-quarter improvement of roughly one percent (see Figure 1 for full price trend). Condominium prices continue to be down dramatically from their high point, showing price declines of nearly 54 percent from their peak in 2007 (see Figure 2 for cumulative annual price change).
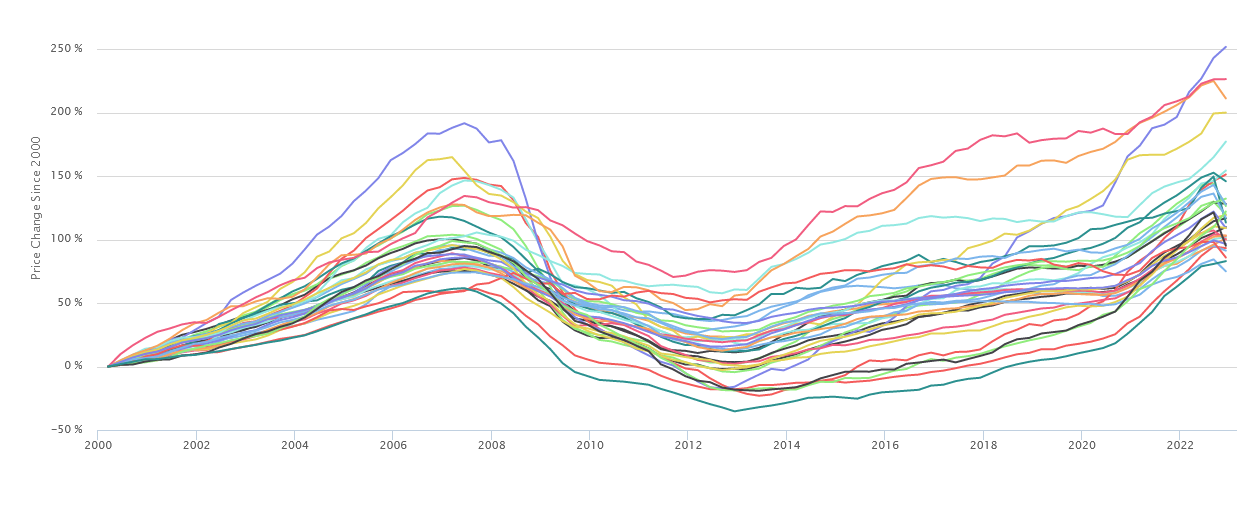
 Figure 2. Cumulative Annual Price Change by Property Type in Cook County, From Price Peak to First Quarter 2013
Two-to-four unit small rental buildings
-
Small rental building prices showed the strongest price gains in the first quarter of 2013. Prices for small rental buildings continued their positive price trends in the beginning of 2013. Since the first quarter of 2012, prices for small rental buildings have increased by over 8 percent year over year (see Figure 1 for full price trend). Despite three consecutive quarters of price increases for small rental properties countywide, prices in the first quarter of 2013 remain at pre-2000 price levels and are still more than 56 percent below peak price levels (see Figure 2 for cumulative annual price change).
Five-or-more unit large rental buildings
-
After a period of strong price gains, larger multifamily rental properties have experienced recent price declines. From the fourth quarter of 2010 to the second quarter of 2012, prices for larger multifamily rental properties increased by more than 37 percent spurred by rising rental demand in Cook County and a limited pipeline of new apartment buildings entering the market. In neighborhoods with strong rental markets, this created increased demand for existing apartment buildings and led to rapidly rising prices for these buildings. Since reaching that high point in the second quarter of 2012, however, prices for larger multifamily rental buildings have declined by 16 percent, and have declined by over 11 percent when compared to the first quarter of 2012. During this period, a growing number of large multifamily rental projects went online or were announced. This had the likely effect of reducing both the demand and price for existing buildings (see Figure 1 for full price trend and Figure 2 for cumulative annual price changes).
High-value properties lead price recovery among all property types
Properties with the highest-value experienced the strongest recent price recovery. Figure 3 illustrates year-over-year price changes by value tier and property type for three residential property types. It shows that high-value single family, condominium, and small rental properties saw the largest year-over-year price increases. (For a complete description of how value tiers are calculated, see the IHS Cook County House Price Index Technical Paper on Sample and Methodology.) For example, high-value single family properties saw year-over-year increases of more than six percent compared to increases of roughly just under six percent for properties in the middle-value segment and price declines in the low-value segment of the market. Additionally, the highest- value condominium properties saw year-over-year price increases of over five percent while low- and middle-value condominiums saw year-over-year price declines. The largest price increases were observed for high-value small rental properties. These properties saw increases of nearly 20 percent between the first quarter 2012 and the first quarter 2013 (see Figure 3 for year-over-year price change comparisons by property type and value tier).
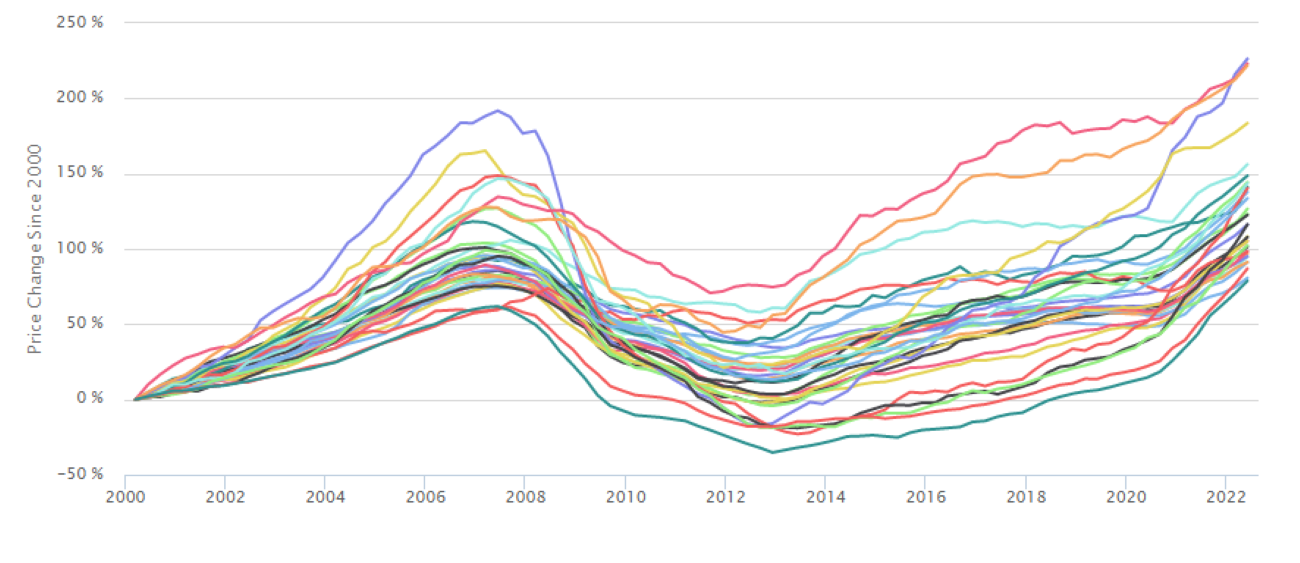
 Figure 3. Year-over-year Price Changes by Value Tier and Property Type, First Quarter 2012 to First Quarter 2013
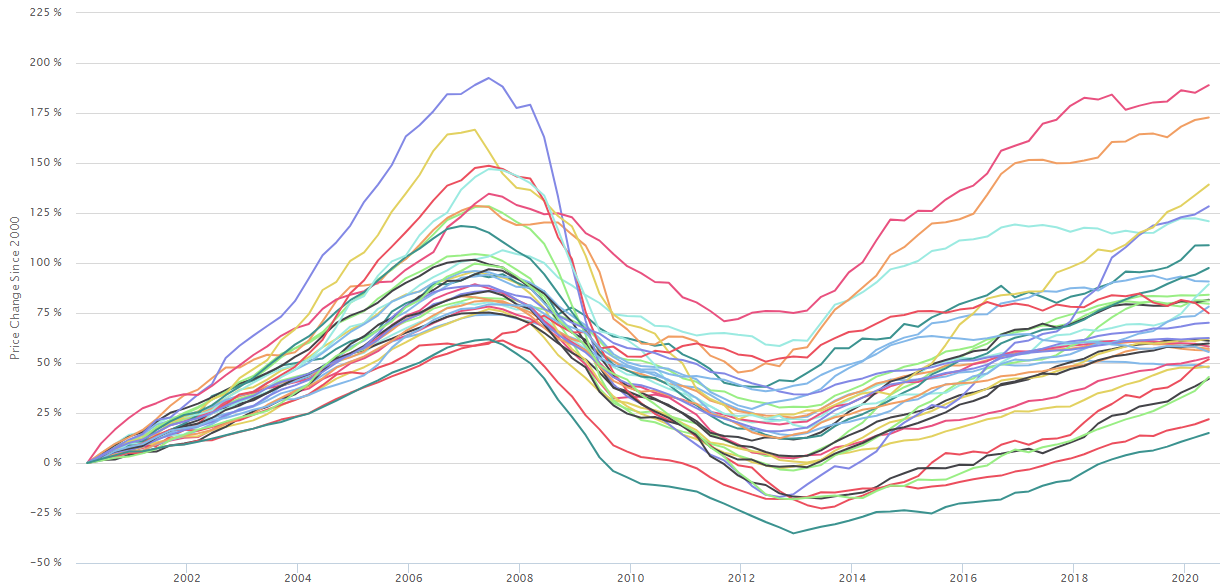
Divergence among price tiers continues
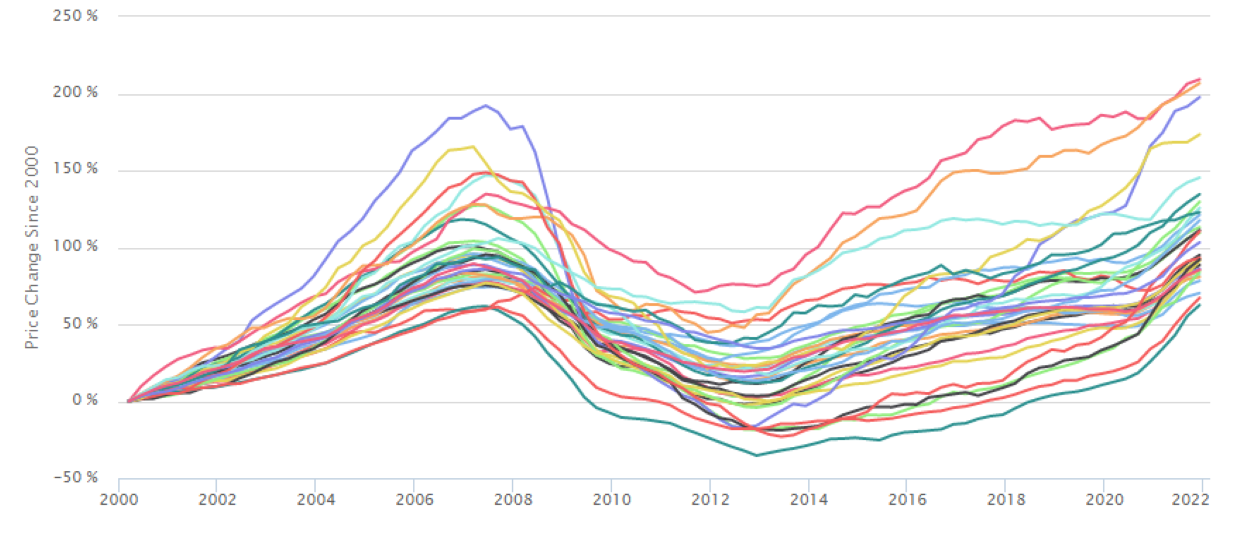
Figure 4 illustrates the divergent price trends for higher, middle, and low-value single family and small rental properties. Prior to 2008, price trends for properties in the three price tiers tracked each other fairly closely within their respective property types. However, beginning in 2008, middle- and low-value properties began to experience dramatic price declines driven by the growing incidence of distressed sales. Meanwhile, higher value properties, while also experiencing negative price trends, did not see the same dramatic declines as did middle- and low-value properties due to the more limited impact of distressed sales. High-value single family and small rental properties have also seen consistent price increases over the past four quarters. (see Figure 4 for price trends by value tier). caption text
 Figure 4. Quarterly Price Trends by Value Tier for Single Family and Small Multifamily Properties
Data Sources
To calculate the IHS Cook County House Price Index, the Institute uses data on property sales from the Cook County Recorder of Deeds (via Property Insight) and Midwest Real Estate Data. IHS also uses data from the Cook County Assessor's Office to determine property characteristics, price tiers, and the weighting of different types of property sales. For more information, click here.