The Fourth Quarter 2013 IHS Cook County House Price Index is calculated from data on single family properties with repeat sales from the first quarter of 1997 through the fourth quarter of 2013. This release of the Index focuses on quarterly price changes for single family homes and tracks the differences in price changes between 28 housing submarkets in Cook County: 14 of these submarkets are located in the City of Chicago and 14 are in suburban Cook County.*
For a detailed description of how the IHS Cook County House Price Index is calculated, click here. For each release of the Index, tabular data is available for download. For this release, the tabular data includes a sortable table of submarkets and submarket definitions. The numbers reported here are seasonally adjusted. For access to all downloadable materials, click the download link at the bottom of the page.
The Fourth Quarter 2013 Index shows a continued recovery for single family house prices in Cook County. However, this price recovery varies across the County. Previous IHS Index releases have illustrated substantial variation in price levels depending on the underlying intensity of foreclosure distress present in the market. For this release of the Index, price trends are broken out geographically by submarket. The data show that in the fourth quarter, countywide price increases were led by a group of submarkets on the northwest and southwest sides of the City of Chicago and suburban Cook County. These areas experienced substantial peak-to-bottom price volatility over the course of the housing crisis, but are seeing strong recent price rebounds and are leading the price recovery. Additionally, a small group of submarkets continue to show weakness and have yet to experience any substantial recent price gains. Meanwhile, a core group of submarkets have exhibited more stable price trends and also continue to see price improvements. Among them, Lakeview/Lincoln Park in the City of Chicago reached a significant milestone as the only submarket that has returned to previous peak price levels observed during the housing boom.
Key Trends from the Fourth Quarter 2013:
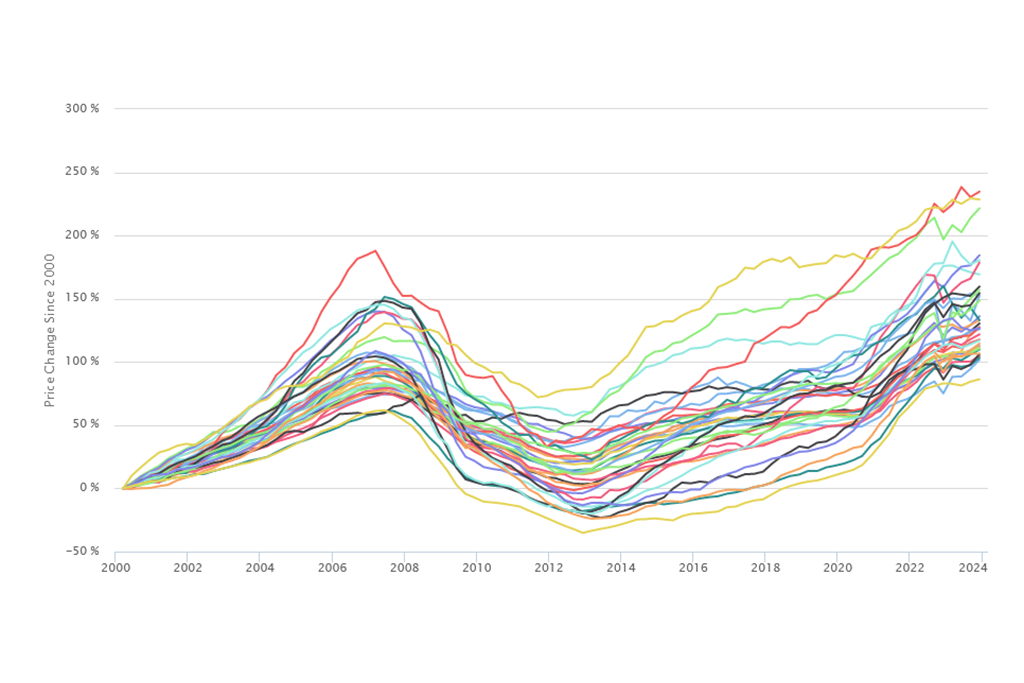
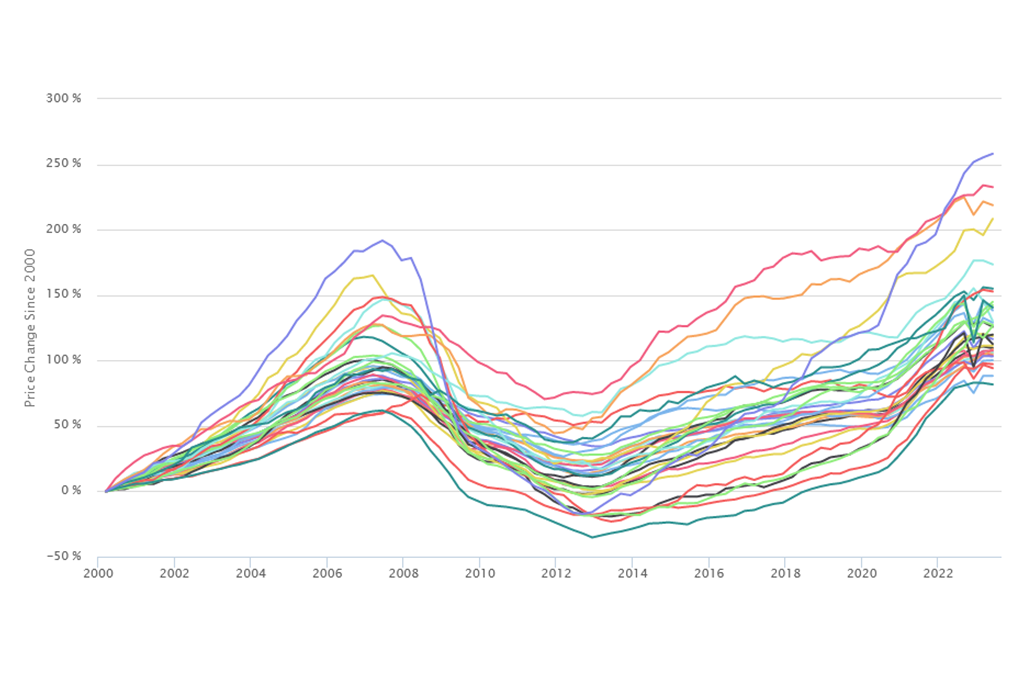
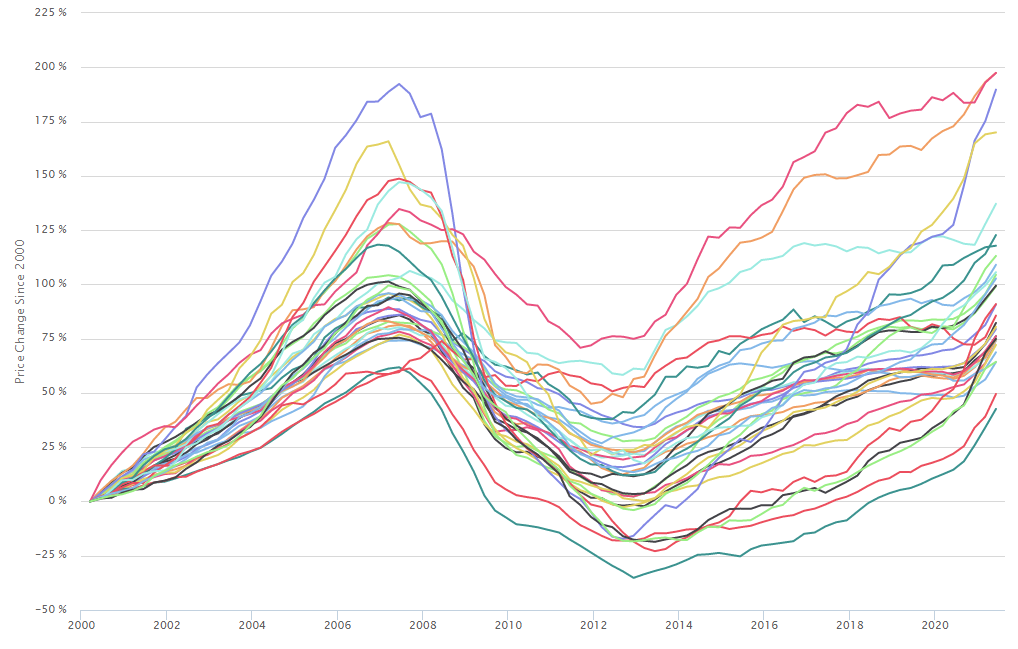
- Single family home prices experienced their largest year-over-year increase in the past 16 years. Figure 1 illustrates long-term price trends for single family homes in Cook County and in the two major subregions of Cook County: the City of Chicago and suburban Cook. It shows that in the fourth quarter of 2013, Cook County single family home prices experienced their fifth consecutive positive quarter. On a year-over-year basis, single family home prices in the fourth quarter of 2013 built off of strong previous quarters and increased by 15.1 percent (Figure 2 breaks out price changes for the City of Chicago and suburban Cook County separately). Figure 3 charts the quarterly year-over-year price increases for single family homes in Cook County since the first quarter of 1998. It shows the 15.1 percent increase in the fourth quarter of 2013 was the largest year-over-year increase during that 16 year period. The previous largest year-over-year increase took place in the third quarter of 2013.
 Figure 1: Price Change for Single Family Homes from 1Q 1997 to 4Q 2013
 Figure 2: Change in Prices of Single Family Homes from 1Q 1997 to 4Q 2013
 Figure 3: Year-over-Year Price Increases for Single Family Homes in Cook County by Quarter from 1Q 1998 to 4Q 2013
- Despite recent, large year-over-year increases, Cook County’s single family home prices have only rebounded to 2002 levels and are seeing slowing quarterly price gains. Compared to peak levels, single family home prices in Cook County are still down by more than 31 percent, and prices are at levels comparable to mid-2002. The large year-over-year price increases in 2013 were primarily built off a strong second quarter, as price growth slowed in the third and fourth quarters of the year. Prices increased by more than six percent between the first and second quarter of 2013. By comparison, prices rose only 2.7 percent from the second to third quarter and by 2.5 percent from the third to the fourth quarter 2013.
Key emerging submarket trends:
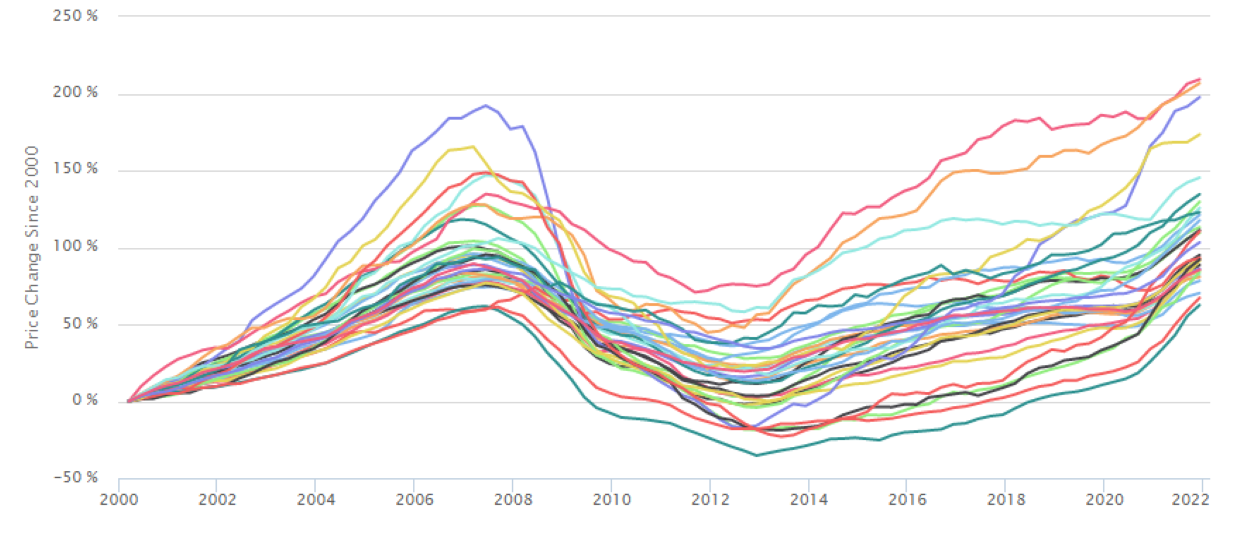
Along with the County as a whole, most submarkets are experiencing recovery, but price gains remain uneven. The IHS Cook County House Price Index breaks out Cook County house price changes for single family homes in 28 Cook County submarkets: 14 are located in the City of Chicago and 14 in suburban Cook County. Recent price trends show that in the fourth quarter of 2013, prices for single family homes in 25 of 28 Cook County submarkets experienced year-over-year price increases. Within these submarkets, there is variation in the size of increases and underlying conditions contributing to these price increases. At the same time, three submarkets were at their lowest, post-housing-crisis levels in the fourth quarter of 2014. Scroll down to find Figure 6, which summarizes key recent price trends for each submarket. The same data in Figure 6 is available as a sortable spreadsheet here.
A group of submarkets leading the price recovery are rebounding from substantial peak-to-bottom price volatility during the housing crisis. Figure 4 maps year-over-year price changes in the 28 Cook County submarkets. It illustrates that three City of Chicago submarkets, Jefferson Park/Edison Park, Irving Park/Albany Park, and Portage Park/Belmont Cragin, experienced year-over-year price increases of greater than 20 percent while another five submarkets saw increases larger than the Cook County average of 15.1 percent.
Figure 6 shows that these areas all experienced substantial peak-to-bottom price declines prior to recent strong price gains. Peak-to-bottom price declines range from 38 percent in Irving Park/Albany Park to more than 57 percent in Chicago Lawn/Gage Park. In these areas, strong recent price growth is indicative that low prices and signs of underlying market strength may be attractive to investors and owner-occupants. Despite recent price growth, many of these areas have a way to go before reaching previous peak levels. For example, Chicago Lawn/Gage Park remains nearly 48 percent off peak levels, and Portage Park/Belmont Cragin is nearly 43 percent off peak.
 Figure 4: Year-over-Year Price Change by Cook County Submarket Q4 2012 to Q4 2013
Prices in a small group of submarkets are still very weak with some areas yet to reach a price bottom. Although most submarkets experienced some type of price recovery in 2013, Figure 4 also maps a group of submarkets with flat or declining year-over-year price trends on the South Side of Chicago and in south suburban Cook County. Most of these submarkets are among the weakest in the region. Figure 6 shows that these areas experienced dramatic price declines during the housing crisis and are at price levels near or below what they were in 2000. For example, south suburban Oak Forest/Midlothian and Chicago Heights/Matteson saw year-over-year price increases of less than two percent, and Calumet City/Harvey saw a 12 percent year-over-year decline. In the City of Chicago, Roseland/South Chicago saw a year-over year price decline of more than 24 percent. Meanwhile, both Calumet City/Harvey and Roseland/South Chicago in suburban Cook County currently sit at recent price lows. Pilsen/Bridgeport is a City of Chicago submarket that saw a year-over-year price decline of three percent, but while other weak submarkets sit at price levels well below 2000 prices, Pilsen/Bridgeport is at a price level more than 11 percent greater than 2000.
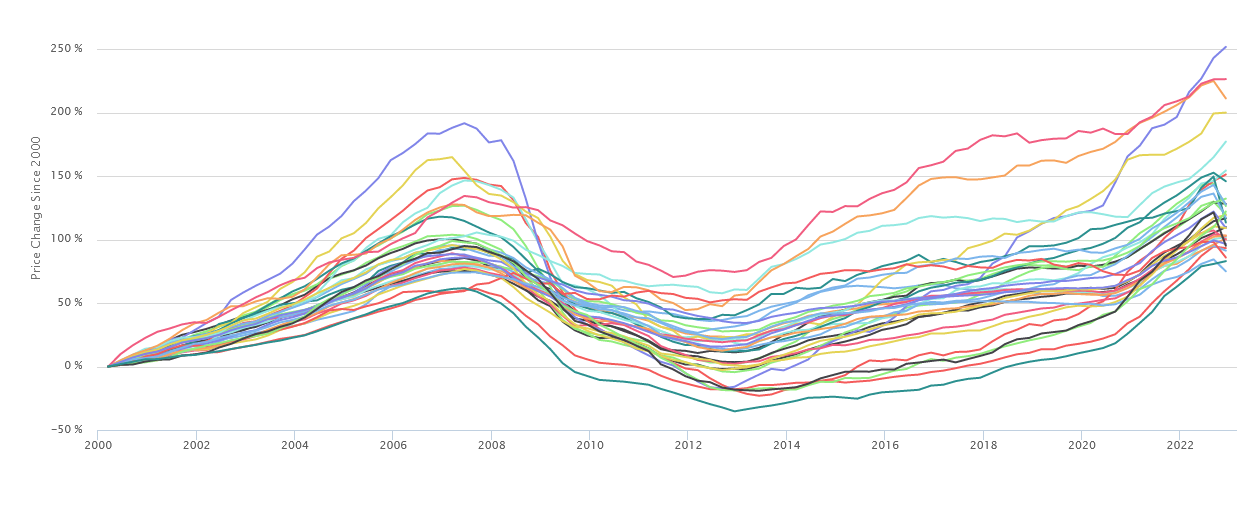
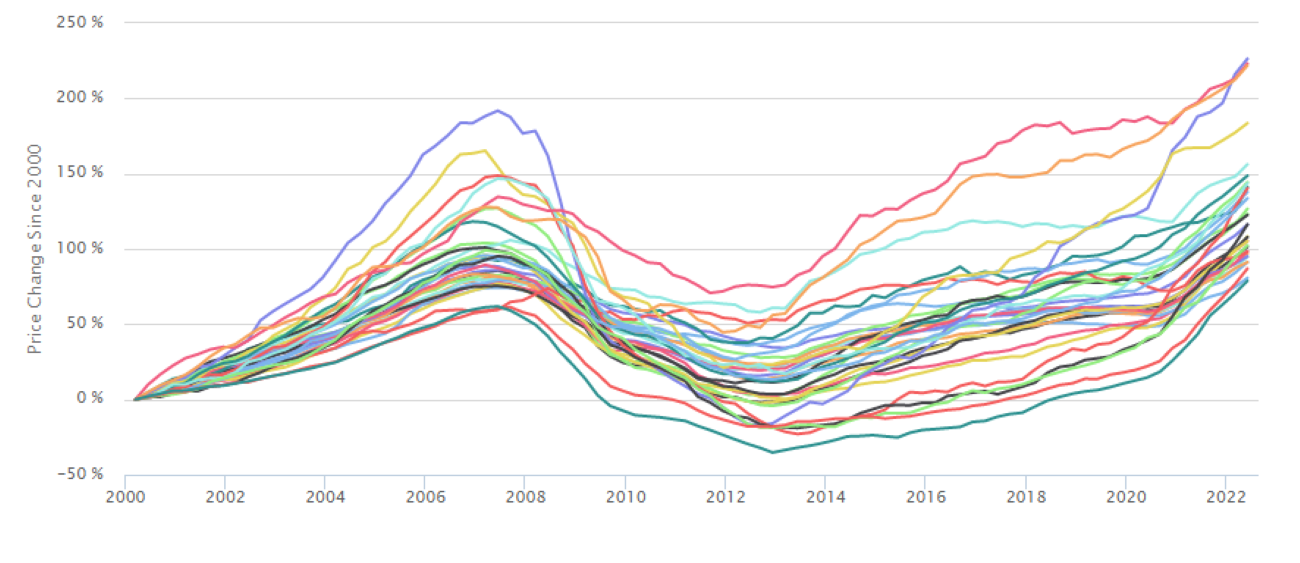
Within Cook County, a core group of strong submarkets are clustered in the City of Chicago. In the City of Chicago, there is a set of neighborhoods with strong and stable single family home prices that have also seen recent price improvements. These areas include Lincoln Park/Lakeview, West Town/Logan Square, Lincoln Square/North Center, and Uptown/Rogers Park. In the fourth quarter of 2013, single family home prices in each of these areas were at least 47 percent greater than 2000 price levels. Figure 5 illustrates long term price trends for these submarkets and shows that these areas also have had the most price stability, exhibiting the smallest peak-to-bottom price declines during the housing crisis.
Because of this relative stability, some of these areas have seen smaller price increases than areas with larger price bubbles. From this group of submarkets, West Town/Logan Square has seen the most substantial recent price growth with prices increasing by 17 percent year-over-year. Despite more modest recent price growth, these areas are the closest to returning to previous peak levels. All of these areas are less than 20 percent off peak price levels, and single family home prices in Lincoln Park have actually exceeded their previous high point during the housing boom. In the third and fourth quarters of 2013, the Lincoln Park submarket reached new peak levels in the Index, and single family home prices in Lincoln Park are 4.5 percent higher than at their previous high point in the third quarter of 2007.
 Figure 5: Price Change for Single Family Homes in Strong Cook County Submarkets from 1Q 1997 to 4Q 2013
Discussion
Data from the fourth quarter 2013 show the Cook County single family housing market continuing its recovery. The fourth quarter built on previous, strong quarterly increases and saw the largest countywide year-over-year price increase since at least 1998. Although the market has observed positive quarter-over-quarter increase throughout 2013, the small quarter-over-quarter increase seen in the third and fourth quarters may indicate a slowdown in price growth. A set of submarkets with the largest recent price increases also are rebounding from large peak-to-bottom price changes during the housing crisis. Additionally, a group of stagnant or declining submarkets continue to struggle to find a foothold to recovery and are seeing very weak price increases or negative price trends. Finally, a core group of strong and stable City submarkets are leading the recovery back to previous peak levels.
 Figure 6: Table of Submarket Price Changes of Single Family Homes from 1Q 1997 to 4Q 2013
* This submarket-level Cook County House Price Index is not precisely comparable to the submarket-level price index calculated for the fourth quarter of 2012. This quarter’s index uses only price changes for single family homes whereas last year’s index combined single family home and condominium sales. Additionally, this quarter’s Index combines some submarkets that have a low number of single family home sales in order to improve the reliability of index calculations.