Photo: Evelyn Ryan
Rental housing affordability remains one of the most pressing challenges facing renters and policymakers in Chicago. IHS research has shown that a key driver of the city’s increasing affordability pressures is its shrinking supply of lower-cost rental units, which is declining faster than demand for housing from lower income renters. This growing mismatch between the supply of and demand for affordable rental units intensifies competition for remaining homes, exacerbates cost burden, and can accelerate displacement pressure in neighborhoods with high or rising rental costs.
In advance of our upcoming State of Rental in Chicago report, this blog presents the newest data on changes in the city's rental housing stock and the demographic and socioeconomic makeup of renters, offering important context for policymakers exploring solutions to Chicago’s rental market affordability challenges. All data discussed in the narrative can be found in the figures or digital appendix.
Homeowner Households Growing Faster than Renter Households
In the aftermath of the Great Recession, rental demand in Chicago increased, the characteristics of renter households shifted, and affordability declined. The share of Chicago households who rent peaked in 2013, plateaued during the housing market recovery period, and declined amid accelerating homeownership demand during the COVID-19 pandemic. By 2023, the latest available data, 53.8 percent of Chicago households rented, down from 56.3 percent in 2012. However, this declining rental rate was largely driven by growth in homeowner households rather than a loss of renter households. Between 2012 and 2023, Chicago gained nearly 172,600 households, with increases in the number of both new owners and renters. Figure 1 charts the number of households by tenure in the City of Chicago. Other data cited can be found in the digital appendix here.
Figure 1. The Number of Renter and Owner Households in the City of Chicago, 2012 to 2023
Growing Mismatch Between Affordable Supply and Demand
As demand for rental housing in Chicago grew after 2012, affordability conditions deteriorated. Figure 2 shows the indexed change in the annual number of rental units that are affordable to households that earn 150 percent of the poverty level (supply) and compares it to the number of households that earn 150 percent of poverty or already live in rental units affordable to these lower-income households regardless of their income (demand). The data indicate that since 2012, affordable demand declined by 7.2 percent while affordable supply decreased by 12.1 percent.
Figure 2. Indexed Change in the Number of Lower Income Renters (Affordable Demand) compared to Affordable Rental Units (Affordable Supply) in the City of Chicago, 2012 to 2023
Figure 3 shows the key components behind Chicago’s affordability gap and highlights the implications of these trends. It shows the share of rental units affordable to lower income renters, the share of renters that are lower income, and the share of lower income renters living in higher-cost units. Since 2012, the share of rental units considered affordable declined by 8.6 percentage points from 45.3 percent in 2012 to 36.7 percent in 2023. At the same time, the share of renters considered lower-income declined by 7.5 percentage points from 53.2 to 45.7 percent by 2023. This trend means that a growing share of lower-income renters are living in higher-cost housing, which is an indication of growing affordability pressures and the challenges lower-income renters face in finding affordable units. Since 2012, the share of lower-income renters living in higher-cost units rose 4.8 percentage points from 37.3 percent to 42.1 percent. Other data cited can be found in the digital appendix here.
Figure 3. Affordability Gap Characteristics in the City of Chicago, 2012-14, 2017-19, 2022-23
Chicago's Changing Rental Housing Stock
Affordability pressures for lower income renters were partially driven by significant changes in Chicago’s rental housing supply. While the city added new rental supply during this time, many of the new units were likely unaffordable to lower-income households. At the same time, a substantial number of existing affordable units were lost. Figure 4 charts changes in the number of rental units by building size, exploring how the stock shifted annually compared to levels in 2012. The data show that larger buildings with 50 or more units accounted for the strongest growth in the rental supply, with units increasing by nearly 28 percent since 2012. Meanwhile, the number of mid-sized rental buildings with 5 to 49 units increased by nearly 19 percent. Growth in both of these building types was largely driven by new construction of market rate rental buildings. However, over the same period, rental units found in small 2 to 4 unit properties declined by nearly 12 percent, highlighting that the composition of Chicago’s rental market has been changing. In 2012, the most common type of rental unit was in a 2 to 4 unit building, a key source of unsubsidized affordable housing typically owned by an owner-occupant or small-scale investor. However, by 2023, the largest share of rental units were found in larger multifamily buildings, marking a dramatic shift in the city's rental stock. Additional cited data can be found in the digital appendix here.
Figure 4. Indexed Change in Rental Units by Building Size in the City of Chicago, 2012 to 2023
Housing Stock Trends Differ by Local Market Context
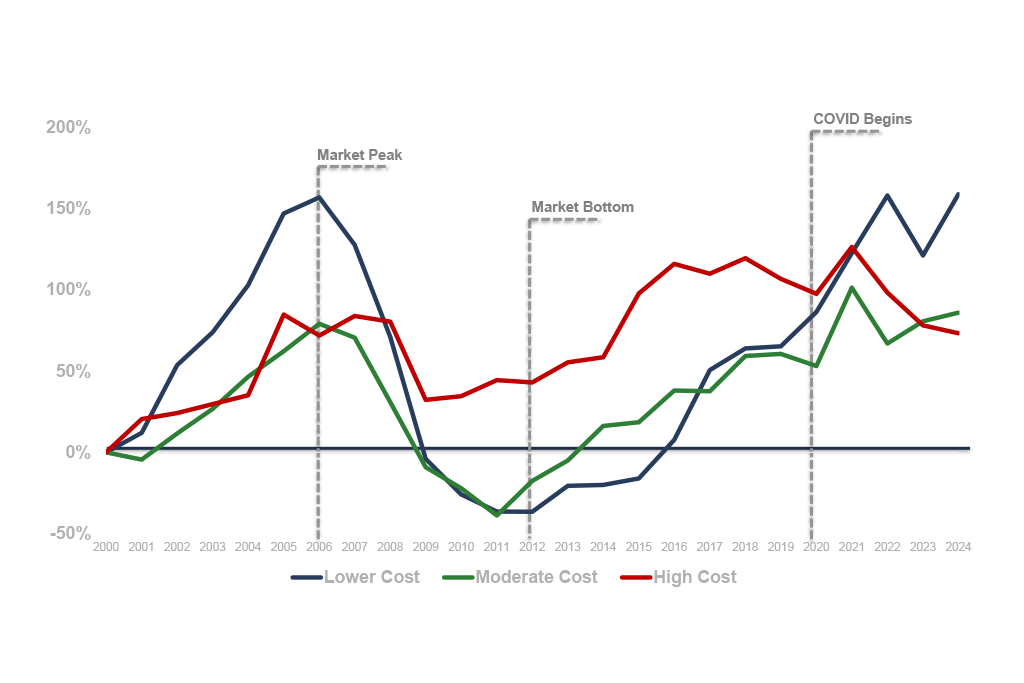
The changing composition of Chicago’s rental market has played out unevenly across neighborhoods. Between 2012 and 2023, the city lost nearly 28,000 rental units in 2 to 4 unit buildings while gaining more than 73,000 units in larger multifamily properties. This growth in new multifamily housing was highly concentrated, with nearly 78 percent of new units being built in higher-cost neighborhoods and likely unaffordable to lower-income renters. The loss of 2 to 4 unit buildings occurred citywide but was most pronounced in neighborhoods at the higher and lower ends of the market. In high-cost areas, these buildings often represent pockets of relative affordability in otherwise expensive rental markets. In lower-cost communities, they provide critical housing options for modest-income renters. IHS research has highlighted several pressures facing this housing stock that are often rooted in the aftermath of the foreclosure crisis, which destabilized 2 to 4 unit buildings across much of the city. In lower-cost areas, these buildings are frequently lost through physical deterioration and rising vacancy. In wealthier neighborhoods, the buildings are often converted into higher-priced single-family homes or condominiums. Figure 5 illustrates these trends, showing changes in the number of rental units by building size across high-, moderate-, and lower-cost communities in Chicago. To learn more about IHS’s market lens, see our analysis Mapping Displacement Pressure in Chicago.
Figure 5. Net Change in Total Housing Units by Building Size in the City of Chicago by Neighborhood Market Type, 2010 to 2023
Uneven Affordability Across Neighborhoods
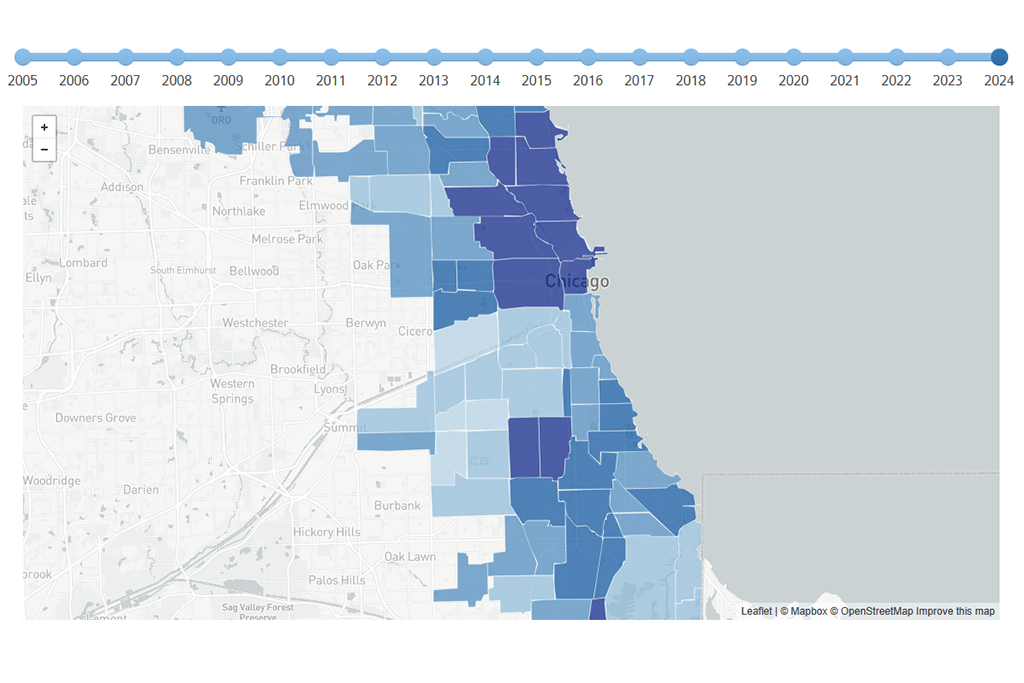
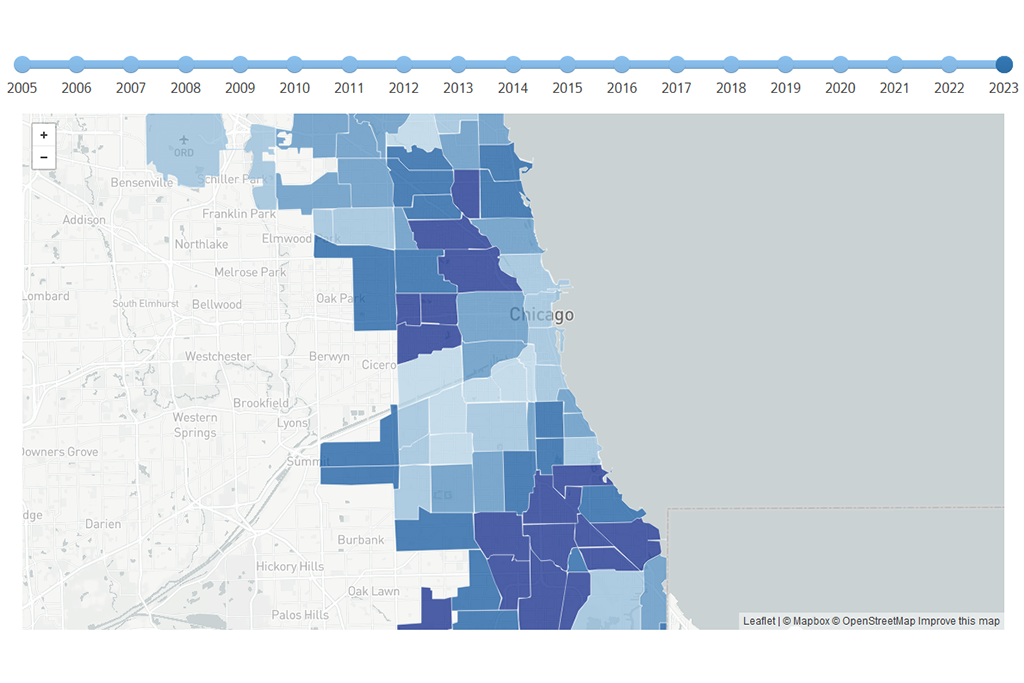
Figure 6 maps the geographic patterns of rental affordability across Chicago submarkets. The data show that downtown Chicago, the north lakefront, and much of the Northwest Side have the lowest shares of rental units considered affordable. This limited supply of affordable housing underscores the challenging conditions faced by lower-income renters in these areas. These neighborhoods also have smaller overall shares of lower-income renter households, and a larger proportion of the lower-income renters in these neighborhoods occupy higher-cost units. Previous IHS research has shown that the loss of affordable rental supply in many neighborhoods parallels the decline of lower-income renter households and the emergence of increasingly extreme affordability challenges.
Figure 6. The Share of Rental Units Affordable to Lower Income Households in City of Chicago Submarkets, 2022-2023
Deepest Affordability Gap for Chicago's Lowest Income Renters
The mismatch between the need for affordable units and the number of units available is most severe for Chicago’s lowest-income households. These households have few affordable options without subsidy. In 2023, 36 percent of renter households earned less than $35,000 per year, but just 18.8 percent of Chicago’s rental units are affordable to these households. IHS data show that only a small percentage of the rental stock is subsidized, meaning most lower-income households are competing with higher-income households for affordable units. Figure 7 explores the share of renter households at different income levels compared to the share of rental units that are affordable to those renters. Figure 8 compares the share of rental units associated with different types of subsidy in high-, moderate-, and lower-cost neighborhoods. Additional cited data can be found in the digital appendix here.
Figure 7. Share of Rental Units that are Affordable Compared to Share of Renter Households in the City of Chicago, 2023
Figure 8. Share of Rental Units that are Associated with Subsidy in the City of Chicago by Neighborhood Market Type, 2023
Policy Responses Addressing Chicago's Affordable Housing Supply Challenges
To address the mismatch between the supply of and demand for affordable rental housing and mitigate displacement pressures, the City of Chicago and local organizations have implemented a number of initiatives focused on the housing supply. These strategies include preserving existing affordability and promoting the development of new affordable rental housing.
These efforts include restrictions on the demolition of 2 to 4 unit buildings in areas experiencing development pressures, the use of Tax Increment Financing (TIF) to support the acquisition and rehabilitation of 1 to 4 unit properties, and the use of Low-Income Housing Tax Credits (LIHTC) and other public funding sources to finance new affordable housing developments. In addition, Chicago has enacted zoning and land use reforms, such as the Connected Communities Ordinance and the Additional Dwelling Units (ADU) Ordinance, to promote increased residential density. Finally, through community-driven initiatives such as the Reclaiming Communities Campaign, the City is partnering with nonprofit organizations to strategically transfer vacant, city-owned land for the development of new housing.
The Institute for Housing Studies has supported many of these initiatives by providing critical data, mapping, and analysis to help practitioners and policymakers ensure programs are targeted and data-informed. Some of this technical assistance work was featured on the IHS blog, such as our work supporting vacant land redevelopment strategies, the preservation of 2 to 4 unit properties, and presentations to Alderpersons on key issues impacting Chicago’s housing market.
IHS’s work tracking changes in Chicago’s rental housing market is ongoing, with new data and insights expected in early 2026. To stay informed about our latest research, subscribe to our newsletter or follow us on LinkedIn.