Articles tagged 'Maps'
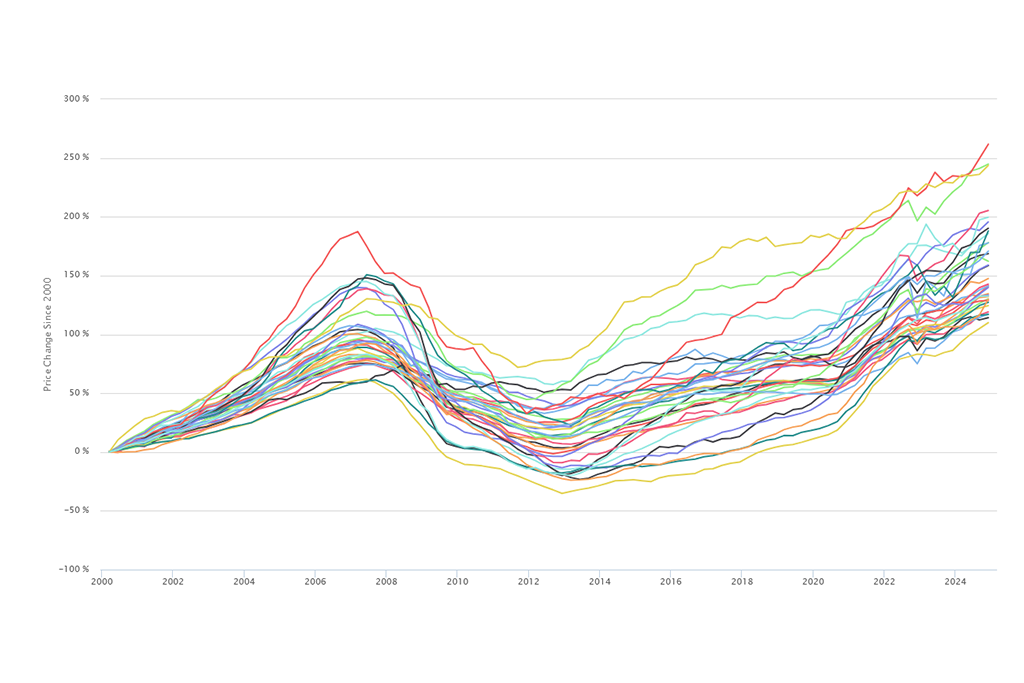
Cook County House Price Index: Fourth Quarter 2024
This update of the Institute for Housing Studies (IHS) Cook County House Price Index highlights changing prices for single-family homes through the fourth quarter of 2024. Data are included for 17 City of Chicago submarkets and 18 submarkets primarily in suburban Cook County.
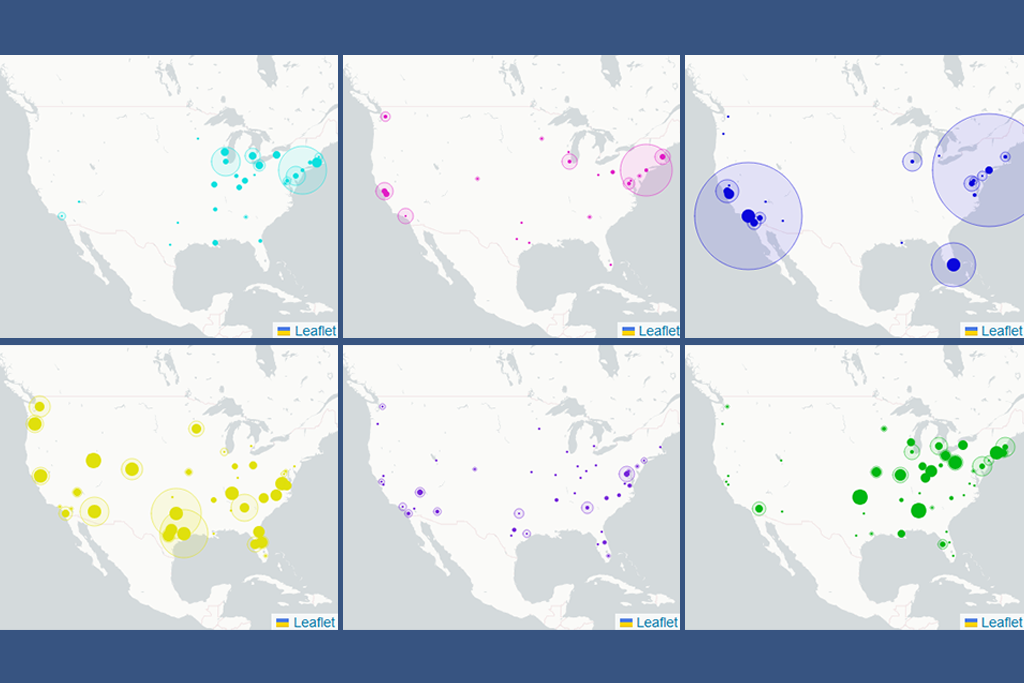
Using Data to Break Up the NOAH Monolith
IHS and the Preservation Compact recently collaborated on a project to inform the development of local and national policies supporting the preservation of unsubsidized, lower-cost rental housing.
Cook County House Price Index: Second Quarter 2024
This update of the Institute for Housing Studies (IHS) Cook County House Price Index highlights changing prices for single-family homes through the second quarter of 2024. Data are included for 17 City of Chicago submarkets and 18 submarkets primarily in suburban Cook County.
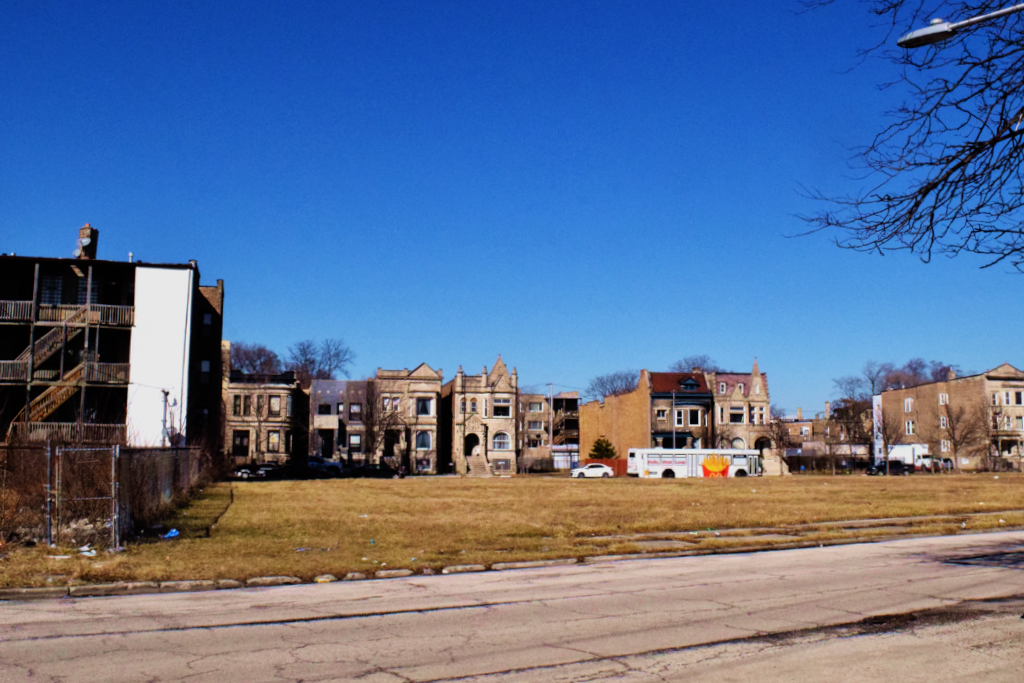
Data Highlighting the ETOD Implications of Vacant Land Near Transit
As part of a recent collaborative project to understand the implications of vacant land near transit, IHS developed an in-depth analysis of City- and privately-owned vacant land near CTA train stations across Chicago. This report highlights data and analysis developed as part of this work.
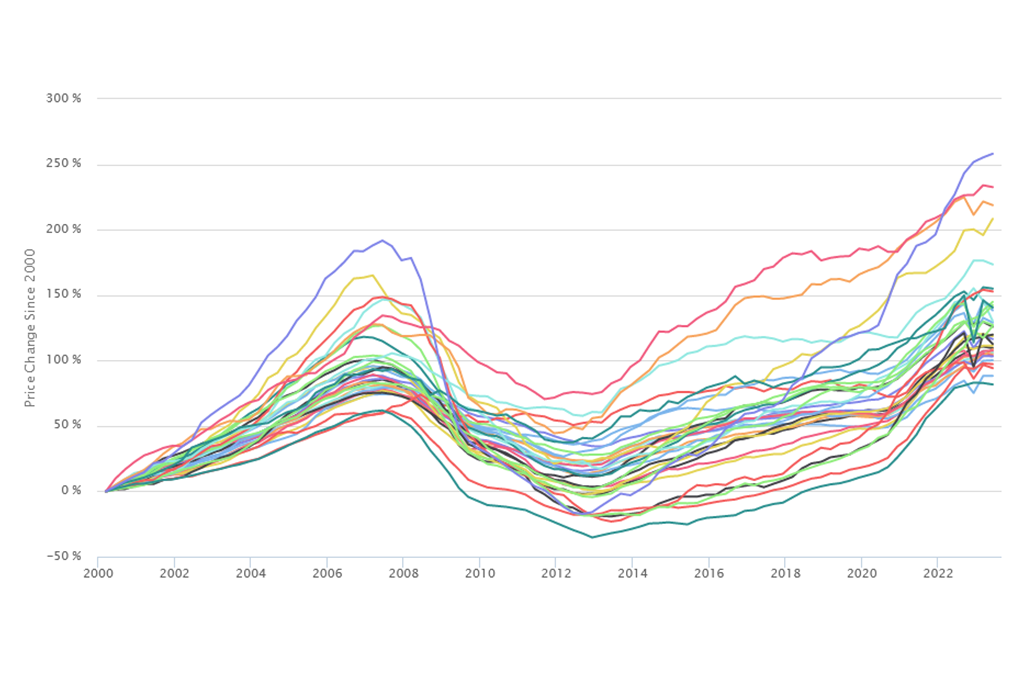
Cook County House Price Index: Second Quarter 2023
This update of the Institute for Housing Studies (IHS) Cook County House Price Index highlights changing prices for single-family homes through the second quarter of 2023 in 16 City of Chicago submarkets and 17 submarkets primarily in suburban Cook County.
Chicago Programs Helping to Expand the Supply of 2 to 4 Unit Properties in Black and Latino Neighborhoods
This blog reviews several programs in Chicago that showcase growing efforts to create a supply of affordable, for-sale housing in neighborhoods that have struggled for decades with disinvestment-related challenges.
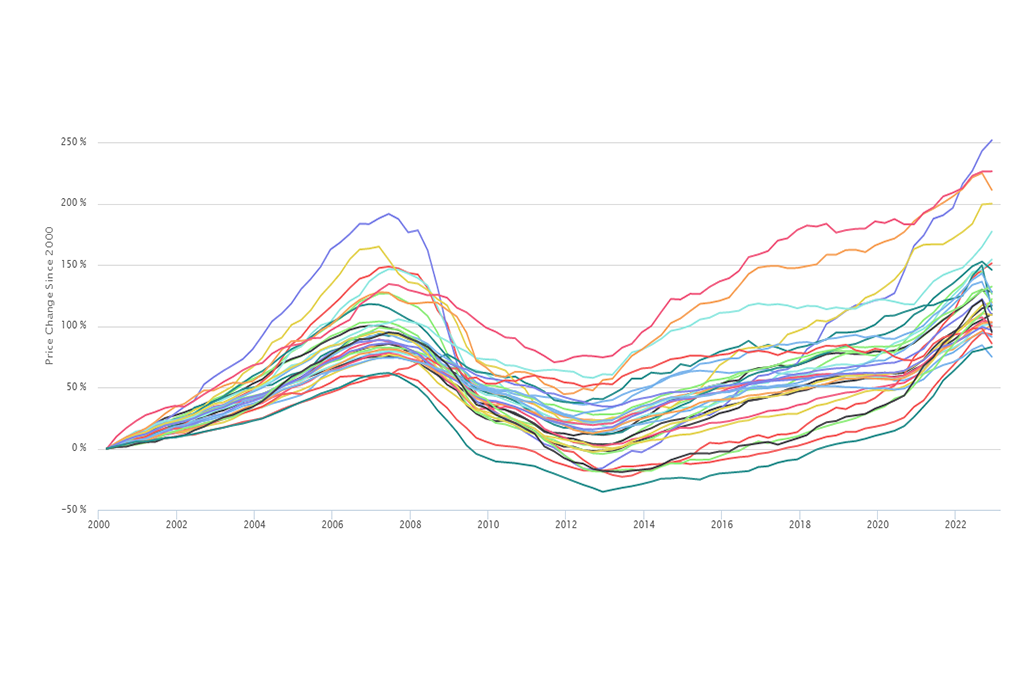
Cook County House Price Index: Fourth Quarter 2022
This update of the Institute for Housing Studies (IHS) Cook County House Price Index highlights changing prices for single-family homes through the fourth quarter of 2022 in 16 City of Chicago submarkets and 17 submarkets primarily in suburban Cook County.
Recent Homebuying Patterns for 2 to 4 Unit Properties
This analysis documents the importance that 2 to 4 unit buildings play in homebuying for Chicago’s borrowers and neighborhoods of color and helps connect policy priorities around preserving 2 to 4s with those that advance homeownership and wealth-building for moderate- and middle-income Black and Latino households.
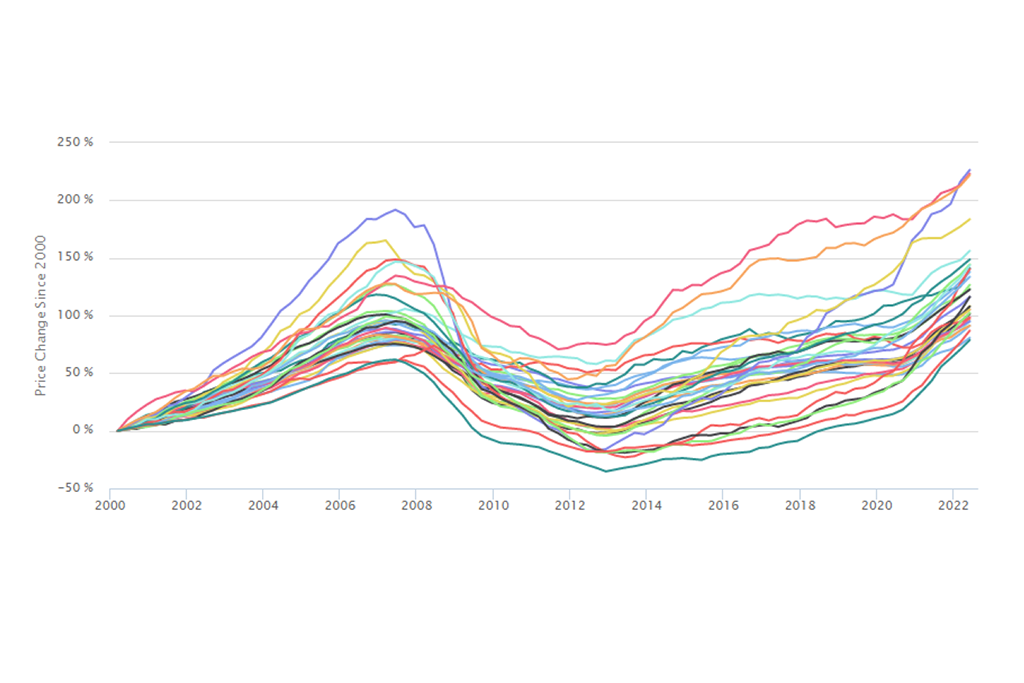
Cook County House Price Index: Second Quarter 2022
This update of the Institute for Housing Studies (IHS) Cook County House Price Index highlights changing prices for single-family homes through the second quarter of 2022 in 16 City of Chicago submarkets and 17 submarkets primarily in suburban Cook County.
An Update to the Mapping Stories of Neighborhood Change Tool
IHS recently updated our Mapping Stories of Neighborhood Change mapping tool to include neighborhood news stories published in 2021 and 2022 mapped alongside our updated Mapping Displacement Pressure data. The mapping tool provides users with spatial, housing market, and demographic context to assess the potential implications of the activities described in each article.
