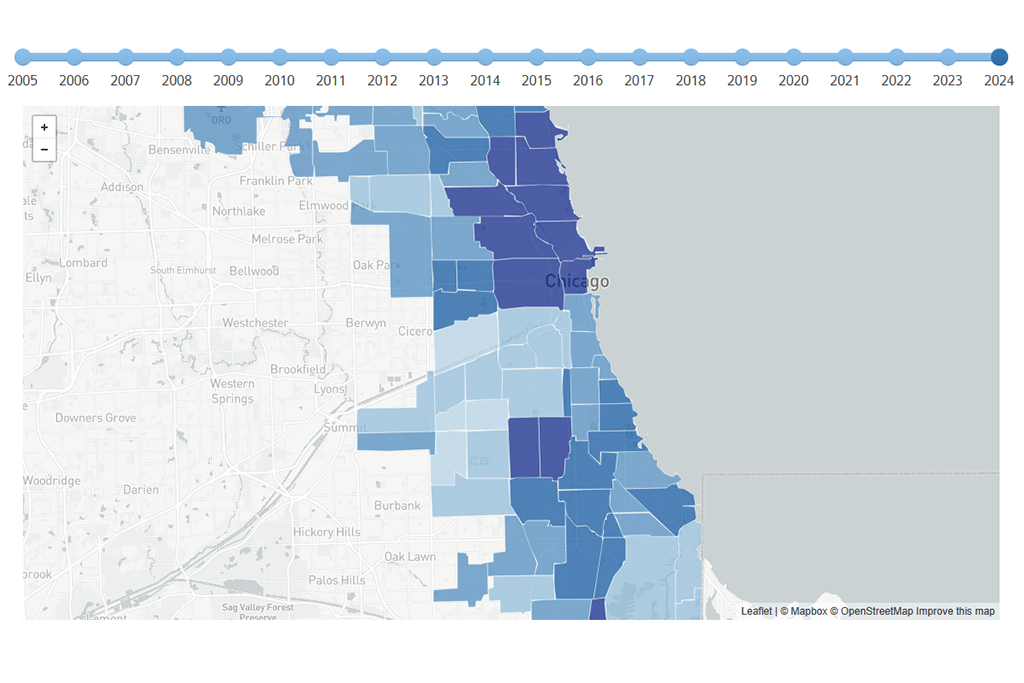
Since 2010, the number of children in Chicago declined by 40,000. Chicago ranks near the top of cities in the nation for child population declines, right behind Cleveland and Detroit. As our research shows, the losses are coming exclusively from low- and moderate-cost neighborhoods. Higher-cost Chicago neighborhoods, in contrast, saw the number of children increase. The trends are visualized by age group and market type in Figures 1 and 2 below as well as by community area in the map at the bottom of this page.
Kristen Faust, president of Neighborhood Housing Services (NHS) of Chicago, is one of many who are concerned about the decline in city’s child population. “We rely on all different ages and skills to add vibrancy to the city,” she said. Children add to the diversity of neighborhoods, they fill classrooms, they are the generation that will support today’s retirees and buy the next generation of homes.
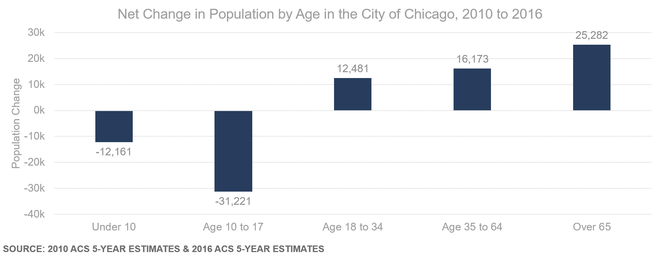 Figure 1
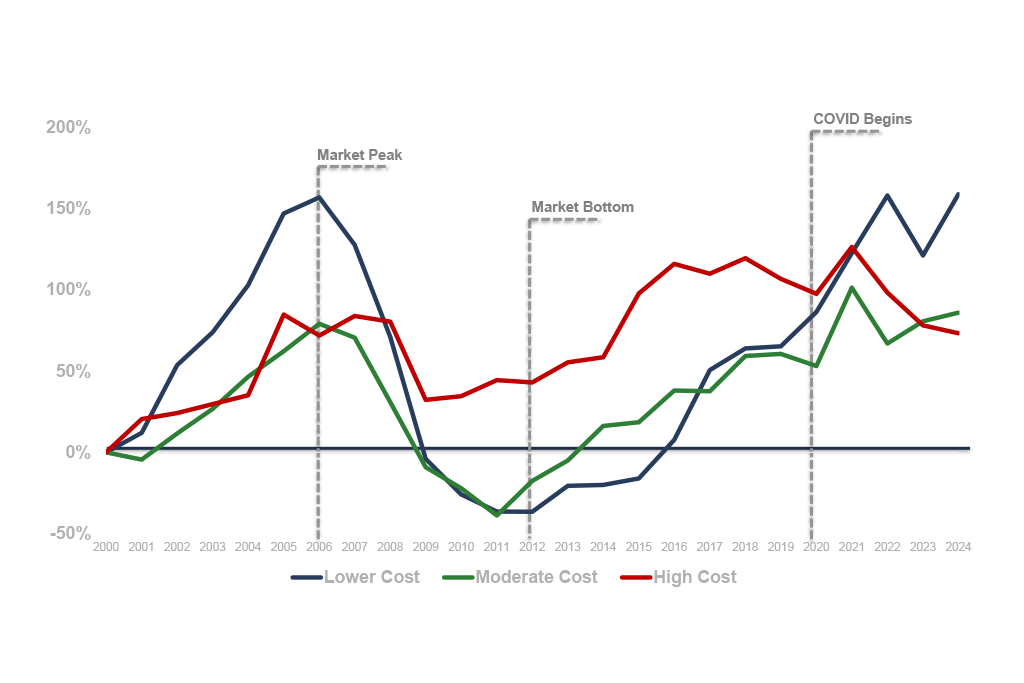
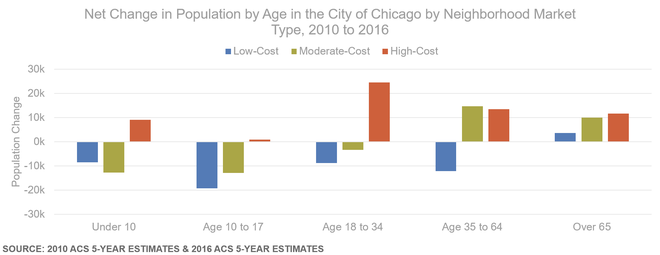 Figure 2: High, low, and moderate income is based on the sales price of 1-4 unit buildings in 2016. For a sense of the relative values in each area, 2016 median sales prices were $440,000 in high-cost areas; $189,000 in moderate-cost areas; and $62,000 in low-cost areas. The data can also be viewed on IHS's Overview of Chicago's Housing Market report.
Displacement Pressures Push Families Out
The reasons for the decline are as varied as Chicago’s neighborhoods. In communities like Albany Park and Logan Square, families are leaving as they get priced out of the housing market and the housing stock changes.
“There are a lot of apartment conversions,” Juan Cruz, communications and research coordinator at Communities United, said of the housing market in Albany Park. Cruz sees newcomers turning two- and three-flats into single-family homes, removing family-sized apartments from the housing stock. Much of the new affordable housing being built is dominated by one-bedroom apartments. Albany Park and neighboring communities have also seen a rise in investors buying up foreclosures.
Cities have always been mobile places with some families moving within a neighborhood and others away from it. Today, Cruz said, families are moving out of state or to the western suburbs.
In many cases, the families who fought long and hard for more investment in the neighborhood are now being displaced. “All of a sudden, amenities are going to be upgraded, tennis courts put in, parks beautified,” Adrian Soto told Elevated Chicago, “and people that have been here for 20-30 years aren’t going to enjoy the fruits of their labor even though they’ve been working hard to improve their community.” Soto is chief strategy officer for Esperanza Health Centers which serve Little Village, Pilsen, and Chicago Lawn.
When families move away, schools are the first to feel the pain. Enrollments decline and with them federal and state funding. When those schools close, it’s not only the children and families who are disrupted. “When you live on a street with an empty building like a school, it deadens the block,” Faust said.
South and West Sides Grapple with Disinvestment
Gentrification is not the reason children are leaving many south and west side neighborhoods. There, said Faust, families are moving away because of crime, lack of jobs, and poor-performing schools, particularly high schools. “It’s a fairly common story that when children hit their teens and have a relative in the southern suburbs with safer high schools, families send their kids there to live,” Faust said.
The loss of blue-collar jobs on the south and west sides is another contributing factor in the exodus of families. As our analysis created to inform the City of Chicago’s five-year planning process makes clear, the middle class in the city is shrinking, leaving a city increasingly of affluent and poor.
“Chicago is a great city because of its diversity,” Faust said. “It was ‘the city that works.’ It takes that diversity to really create the vitality you need to have a growing city, and when certain services and amenities start diminishing, then families vote with their feet. And that leaves the rich and the poor. And that is not sustainable.”
Higher Income Neighborhoods Draw Children
Not all neighborhoods are seeing declining numbers of children. As the chart above shows, higher-cost neighborhoods, in contrast, are seeing more strollers on the streets, not fewer. The draw of certain city neighborhoods—easy commutes, walkability, and amenities—is convincing new parents to stay put, and not only in Chicago.
“We’re not seeing people resume that old pattern of moving to the suburbs after the kids arrive,” city planning director Karl Moritz told the Washington Post of DC’s baby boom. The DC Policy Center predicts a 25 percent increase in K-12 enrollment in DC schools over the next decade.
Instead, families are staying put in the city, for a variety of reasons. When the recession made getting a mortgage more difficult, many young families stayed put in the city. By the time the housing markets loosened, the thought (and cost) of a long commute plus the draw of walkable neighborhoods with parks and coffee shops led many residents to stay put. However, the high and rising cost of housing in these neighborhoods may mean that staying and taking advantage of these amenities may not be an option for all families.
Chicago is seeing some of the same patterns, with a sharp rise in the 18–34-year-old population moving into high-cost neighborhoods. Already the number of children under 10 is on the rise in these neighborhoods. Whether the baby boom continues will depend on whether Chicago can continue to meet the demands of families without pricing them out. The city’s schools will be an important factor. As new research is showing, the city’s schools are making progress on key indicators of quality.
Neighborhoods, too, must be able to draw new residents. Signs of progress are slow but building, said Faust of NHS. Their work in Englewood and Woodlawn to promote homeownership as a means of community revitalization and family financial stability, is bearing fruit.
The Renew Woodlawn partnership, a program helping lower-income families buy or renovate a home, has just signed up its 37th new homeowner in Woodlawn, which showed a slight population gain last year. “It’s about housing, but it’s also about improving the schools, greenspace, and marketing the community,” Faust said. Yet as she notes, only one-third of those new homeowners had kids.
The map below visualizes the percent change in the population under age 18 by community area. Clicking a community area provides additional data points about population changes. You can access a full-screen interactive map by clicking here.

