The Housing Market Conditions Report is released in conjunction with the annual update of the IHS Housing Market Indicators Data Portal. The objective of this report is to help users of the IHS Housing Market Indicators Data Portal understand how to interpret IHS market conditions indicators such as levels of foreclosure distress, the characteristics of property sales, or levels of mortgage credit and how they vary across the region in the most recent data.
IHS’s housing market indicators were created to help users understand key trends in local housing market conditions and to help stakeholders develop and target policies and programs to improve neighborhood stability.In the past year, IHS expanded its Data Clearinghouse beyond Cook County to the Chicago region. Housing market conditions indicators data from 2005 to 2014 are now also available for DuPage, Kane, Lake, McHenry and Will Counties and 261 metro area municipalities. This edition of the Housing Market Conditions report focuses on key trends in market conditions in 2014 with a focus on how conditions vary across the Chicago metro region.
Key trends in 2014 Housing Market Conditions Indicators:
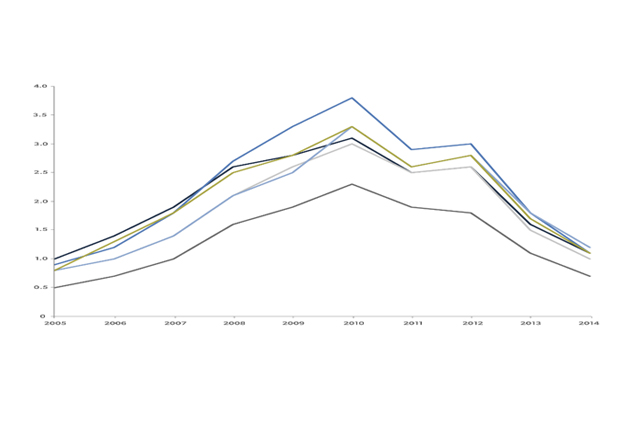
In many counties, municipalities and neighborhoods across the region, foreclosure activity is at or below 2006 levels. After slowing levels of new foreclosure filing activity and an increase in properties completing the foreclosure process at auction in 2013, the foreclosure pipeline continued to clear in 2014. There are fewer cases entering the foreclosure process as well as fewer properties completing the foreclosure process and becoming Real Estate Owned (REO). As illustrated in Figure 1, all counties in the Chicago region have seen dramatically declining levels of foreclosure filing activity since 2012, and in most counties new foreclosure filing activity has declined to levels similar to 2006 or earlier.
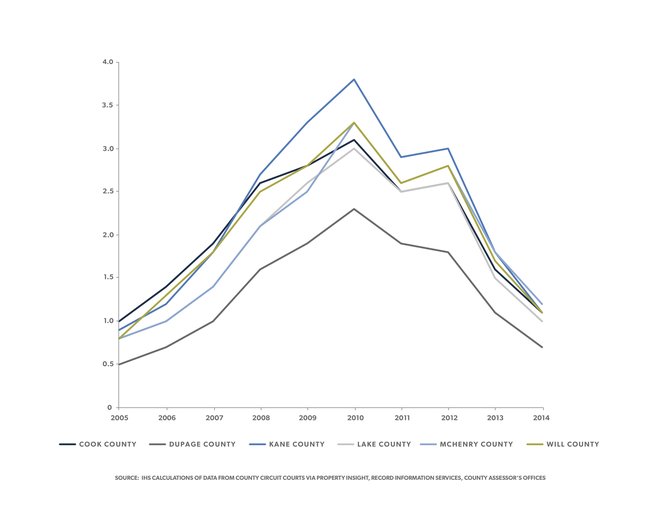 Figure 1) Annual Foreclosure Filings per 100 Residential Parcels by Metro Area County, 2005 to 2014
A clearing of the foreclosure pipeline means that fewer properties are entering the foreclosure process while properties continue to exit the process. This reduces the large backlog of foreclosure cases that had developed. In many ways this is a positive indicator that signals the end of the most critical period of the housing crash, when practitioners and policymakers struggled to help homeowners in financial distress while also managing the onslaught of new vacant, foreclosure-distressed properties. Figure 2 shows that the level of properties exiting the foreclosure process and becoming REO declined for most counties between 2013 and 2014, but remains high relative to pre-crisis levels*.
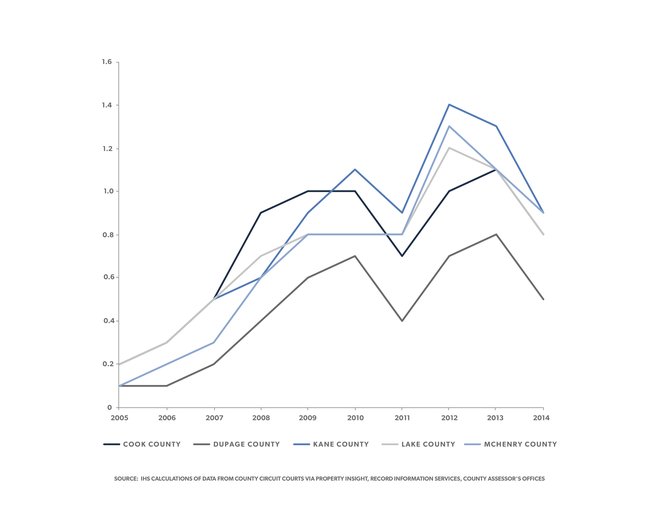 Figure 2) Annual Properties Entering REO status per 100 Residential Parcels by Metro Area County, 2005 to 2014
Although many communities may have largely shifted from responding to the most immediate outcomes of the crash, the impact of the foreclosure and economic crisis still shapes housing markets and policy responses in many areas across the region. Considerable IHS research has documented the disproportionate impact that the foreclosure crisis has had in some neighborhoods and how persistent and high levels of foreclosure activity during the height of the crisis has left a legacy of concentrated vacant properties, dramatic loss of value on single family homes, and low demand for owner-occupied housing.
To examine trends and patterns in foreclosure filing and REO activity at different units of geography throughout the Chicago metro region, use the IHS Data Portal to navigate across data sets and geographies.
In many communities, investor buyers continue to be major players in the single family property purchase market, although this trend has weakened slightly in 2014.Over the course of the housing crisis, one of the key emerging trends was the dramatic growth of business buyers focused on acquiring and renting single family homes. IHS has produced a number of research pieces highlighting the role and potential impact of business buyers in Cook County’s single family housing market. Investors operate at different scales, from large institutional investors to smaller business entities. They also operate under different business models, from “flippers” to “milkers” to “holders” to “rehabbers”, and operate in different neighborhood housing markets. Generally, business buyers focused on single family rental tend to be active in areas where a large number of foreclosure-distressed properties have depressed prices, but where rental demand remains high enough that a single family home can be purchased and rented profitably. Because business buyers tend to purchase properties out of foreclosure-distressed situations and use cash, markets with high levels of business buyer activity tend to have elevated levels of cash purchases and elevated levels of distressed property purchases.
Recent price gains and a decline in the number of properties coming online via the foreclosure process, led to declining levels of regional single family business buying activity in 2014 as shown in Figure 3.
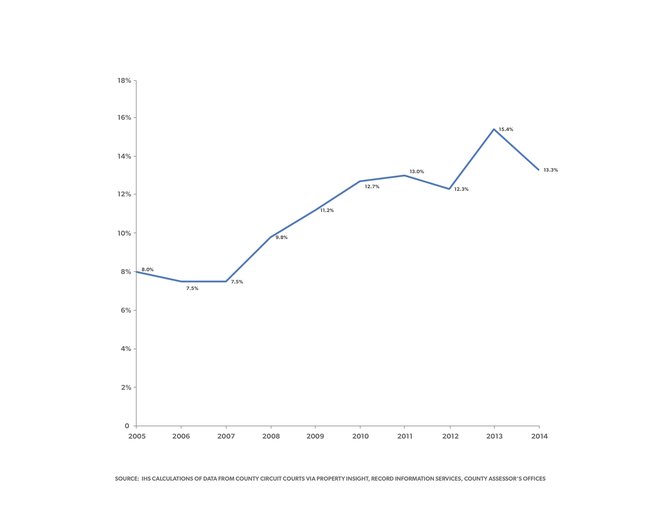 Figure 3) Percent of Single Family Homes Purchased by Business Buyers in the Chicago Metro Area, 2005 to 2014
Despite regional declines, levels of single family business buying remain high in certain communities. The chart below shows the three municipalities with the highest levels of single family business buying in each regional county. To further examine patterns of business buying, cash purchases or distressed property purchase activity at different units of geography throughout the Chicago metro region, use the IHS Data Portal to navigate across data sets and geographies using the filter.
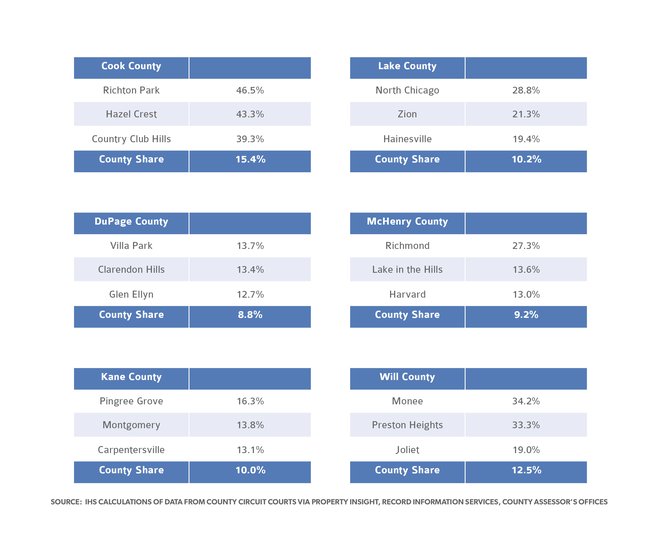 Figure 4) Top Three Municipalities by Share of Residential Properties Purchased by Business Buyers for Each Chicago Metro Area County, 2014
Region-wide, mortgage originations remain weak relative to pre-crisis levels, but levels of mortgage credit vary dramatically neighborhood to neighborhood. The dramatic decline in mortgage credit following the boom years of the housing market is another defining characteristic of the housing crisis. Regionally, lending levels dramatically declined, particularly after 2007, and there has been very limited recovery. Figure 5 shows that after slight gains in levels of mortgage credit seen in 2012 and 2013, largely driven by low interest rates and high levels of refinance activity, regional mortgage activity declined in 2014 and is now lower than at any point during the recession. This decline in lending is related to rising interest rates, continued tight bank underwriting, and weak demand for owner occupied housing. These factors have reduced the demand for refinance loans and kept levels of home purchase lending low.
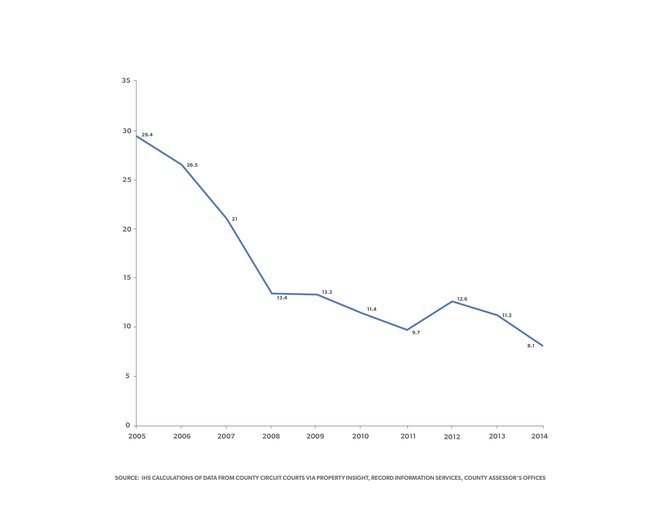 Figure 5) Mortgages per 100 Residential Parcels for Chicago Metro Area, 2005 to 2014
Levels of credit vary across counties, municipalities and in neighborhoods, however. As has been reported in quarterly updates of the IHS House Price Index and as is shown in other housing market conditions indicators, the housing market recovery has been very uneven. Levels of mortgage lending tend to be highest in areas with more stable house prices, where demand for owner-occupied housing is stronger, and where negative market conditions such as high levels of vacancy and distressed properties are less present. Figure 6 below highlights the variation in levels of mortgage credit within the region. For each regional county, it shows the two municipalities with the highest and lowest levels of mortgage lending in 2014. To further examine patterns of mortgage lending activity at different units of geography throughout the Chicago metro region, use the IHS Data Portal to and navigate across data sets and geographies using the filter.
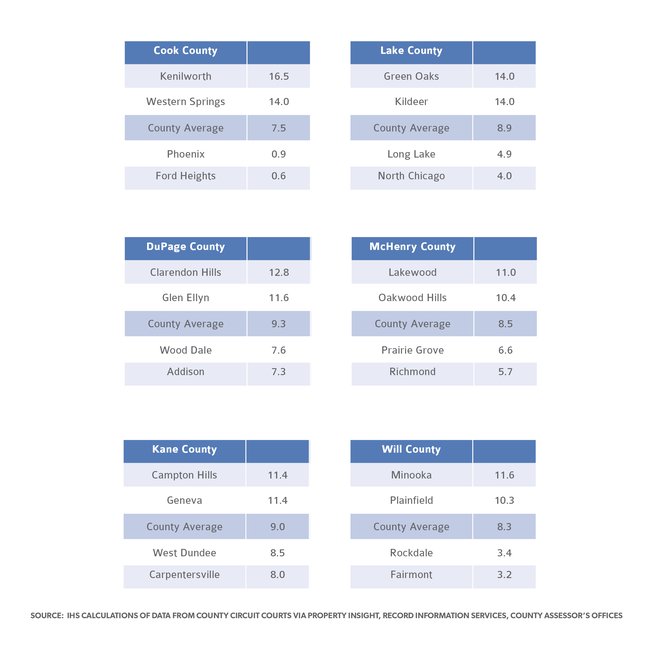 Figure 6) Two Top and Bottom Municipalities by Mortgages per 100 Parcels for Each Chicago Metro Area County, 2014
For more information on the data sets, access information specific to housing stock, property sales, mortgage activity, foreclosure filings, foreclosure auction or vacancy data in the embedded links or at the sidebar to the right. For more information on how to use these data, see our blog post tutorials on mortgage and property sales data. For questions, custom analysis or technical assistance contact IHS Associate Director Sarah Duda. And to be notified about reports, analysis, data or blog posts and to give us feedback, follow us on Twitter, like us onFacebook, or join our LinkedIn Group.
*Auctions data for Will County were excluded in Figure 2 due to a substantial lag in deed recordings that influenced the flow of property records from 2012 to 2014.
