Despite a broad interest in the topic and its importance for inclusive and equitable development, gentrification and displacement are notoriously difficult to study and even more difficult to predict. IHS’s Mapping Displacement Pressure in Chicago project gives practitioners and policymakers 1) a leading indicator to understand neighborhood-level displacement pressure and 2) a market-based lens to guide proactive interventions that advance equitable and inclusive policies to preserve housing affordability. This analysis examines IHS’s updated displacement pressure maps and how market pressure may be changing in Chicago neighborhoods. The goal is to give neighborhood stakeholders a timely resource to understand shifting levels of market activity and highlight which areas in the City of Chicago may be experiencing increased displacement pressure.
Last year, the Institute released the first edition of Mapping Displacement Pressure in Chicago which brought together granular data on current and changing house prices and paired it with data on vulnerable populations to identify Chicago neighborhoods with different levels of displacement pressure. The analysis identified three neighborhood-types with different levels of displacement pressure:
- High-cost – Neighborhoods with vulnerable populations, rising prices, and housing that has become among the most expensive in the City. Because of this mix of conditions, these areas are likely already experiencing active displacement of lower-income residents due to high and rising costs.
- Moderate-cost – Neighborhoods with vulnerable populations, rising prices, and house prices near the City average. These neighborhoods are currently affordable, but could be at a “tipping point” if place-based investments and strategies attract increased demand for housing from higher-income households.
- Lower-cost – These neighborhoods are among the lowest-cost in the City and displacement is more the product of decades of disinvestment as opposed to rising housing costs. Rising prices in these areas can be considered positive, but may also be the product of speculative investment activity. A broad spectrum of place-based community development strategies to improve quality of life in these neighborhoods is needed, but these should be paired with affordable housing strategies to ensure long-term residents can benefit from those investments.
This year’s updated analysis focuses on neighborhoods in the City of Chicago where house prices saw significant shifts between 2016 and 2017 which raise concerns about increasing levels of displacement pressure. It finds that displacement pressure increased in communities throughout the City, including a group of neighborhoods on the west side of Chicago near transit and in a group of neighborhoods on the north side where gentrification concerns have long been on the radar for local activists. House prices have also increased for a set of south side neighborhoods where prices are still low, but where proximity to the future Obama Presidential Center raises concerns that speculation may be underway. For more on the project and to view this year’s map of vulnerable Chicago neighborhoods experiencing rising costs, click here.
Key Findings
Most neighborhoods in the City of Chicago that IHS identified as likely experiencing some level of displacement pressure in 2016 did not see sufficient changes in prices in 2017 to either exacerbate or reduce housing affordability pressure. Of the 304 census tracts in the City with resident vulnerability and rising or rapidly rising house prices, the level of pressure did not increase or decrease between 2016 and 2017 in 81.6 percent of census tracts. Instead, these areas continue to have similar displacement pressure and risk for lost affordability as the previous year. Despite remaining stable, these areas should continue to be a focus for policymakers as they evaluate potential future development and plan for maintaining and increasing housing affordability amid planned investment. To explore the full 2017 map, click here. For more information on overall shifts observed between 2016 and 2017, see the Technical Addendum for the 2017 study.
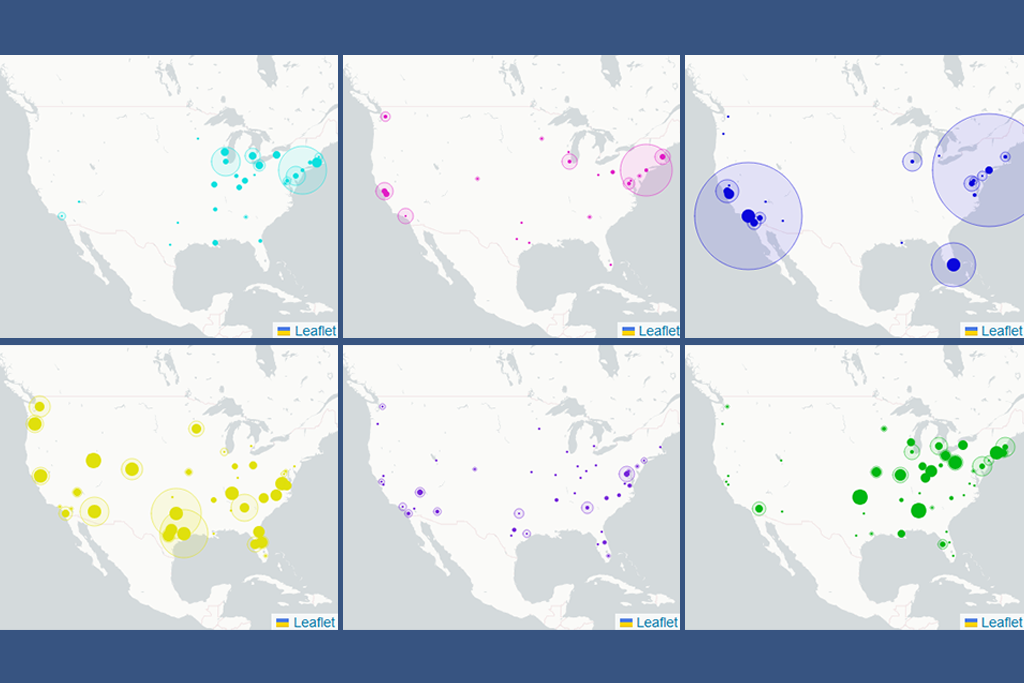
Displacement pressure increased for a small group of neighborhoods where development is underway or being planned and community residents have been concerned that the potentially catalytic nature of these investments could create shifts in the affordability of their neighborhoods. The interactive maps below feature census tracts in the City of Chicago where displacement pressure increased between 2016 and 2017. Figure 1 maps 25 census tracts that were identified in 2016 as vulnerable with rising costs but where displacement pressure intensified in 2017 from moderate-cost to high-cost or from lower-cost to moderate-cost. Figure 2 maps 70 census tracts that, while vulnerable in 2016, were price-stable or had declining prices and therefore were not identified by IHS as sites of active displacement pressure. These conditions changed in 2017, and these areas are now experiencing rising or rapidly rising prices. Both of these types of communities are of concern because IHS research has found that displacement pressure can quickly accelerate, and, as communities experience heightened levels of lost affordability, the variety and effectiveness of interventions to preserve affordable housing for vulnerable populations begin to narrow. For a fact sheet describing interventions to preserve or create affordable housing in different market types, click here.
Intensifying Displacement Pressure Areas
>> High-cost areas with vulnerable populations that were previously affordable
Neighborhoods include parts of the western portion of Logan Square bordering Hermosa, the southwestern section of Avondale bordering Logan Square, and the western part of The 606 in Humboldt Park. In 2016, these areas were identified as moderate-cost in IHS’s analysis but have recently seen accelerated prices and are now among the highest cost areas of the City. Vulnerable populations in these communities are likely undergoing increased housing cost burden or active displacement, and proactive planning is essential to preserving affordability and neighborhood diversity.
>> Moderate-cost areas with vulnerable populations that were previously lower-cost
Neighborhoods include sections of Austin and East Garfield Park served by the Green and Blue Line CTA trains, Woodlawn just southeast of the 63rd and Cottage Grove Green Line stop, and South Lawndale near the California Pink Line CTA stop and proposed site of the future El Paseo trail. These communities were among the lower-cost areas of the City in 2016, but have recently appreciated in value to include them among the more moderate-cost neighborhoods in Chicago. While certain areas may simply be stabilizing in values, the proximity of these sites to rapid transit and to proposed future development raise concerns about future displacement risk.
Figure 1. Census Tracts with Intensifying Displacement Pressure, 2016 to 2017
Emerging Displacement Pressure Areas
>> High-cost areas with vulnerable populations that were previously price-stable
Neighborhoods include large transit-accessible sections of Uptown, the northwest section of Edgewater bordering Rogers Park and West Ridge, sections of Irving Park serviced by the Blue Line, and portions of Albany Park. These communities have long been higher-cost, but have only recently seen increases in prices above the City average—which may amplify affordability challenges and displacement pressure for the vulnerable populations living in these communities.
>> Moderate cost areas with vulnerable populations that were previously stable prices
Neighborhoods include parts of Belmont Cragin and Portage Park adjacent to higher-cost communities, as well as much of Bridgeport cradling the south branch of the Chicago River, portions of east Woodlawn near the future site of the Obama Presidential Center, and the areas along the Red Line CTA stops and the Dan Ryan expressway in Chatham. Recent price appreciation and their strategic locations near stronger markets, transit, and proposed development, may indicate future lost affordability and possible speculative investment activity. Additionally, these neighborhoods may be candidates for more aggressive interventions to preserve affordability and community ownership.
>> Lower-cost areas with vulnerable populations that were previously price-stable
Neighborhoods include much of the south side of Chicago, including parts of Washington Park, Greater Grand Crossing, Auburn Gresham, Pullman, South Deering, Englewood and West Englewood, as well as sections of Austin and North Lawndale on Chicago’s west side. These areas are still among the lowest-cost areas of the City and recently increasing values are a positive trend. Still, these communities are in need of continued investment in tandem with strategies to increase resident incomes and increased community ownership.
Figure 2. Census Tracts with Emerging Displacement Pressure, 2016 to 2017
About the Project
Concerns that existing residents will not benefit from the development of a new neighborhood amenity can quickly follow the announcement of a large-scale public investment project. A new amenity can increase demand for housing from higher-income households or from investors, leading to rising prices and conditions that can make housing unaffordable to current lower- or moderate-income residents.
The impact of a new public investment can vary based on the characteristics of surrounding neighborhoods, however. Local conditions matter, as does the vulnerability of the local population to displacement should house prices increase significantly. For example, IHS research found that the introduction of The 606 linear park system had no effect on house prices in high-income, high-cost, largely owner-occupied neighborhoods along the eastern half of the trail, but led to a substantial increase in prices in the lower-income, more affordable, high-renter neighborhoods surrounding the western half of the trail—likely putting pressure on the residents already struggling to afford housing in their neighborhood.
Beyond these underlying housing market and demographic characteristics, there are other location and environmental factors that may influence displacement risk. For example, neighborhoods near the western half of The 606 have other characteristics such as proximity to transit and higher-value markets that likely amplify its appeal to investors and higher-income households. Conversely, evidence also suggests that neighborhood conditions such as high crime, lack of existing amenities, or isolation from strong real estate markets can discourage private investment and potentially mitigate short-term displacement pressures associated with a public investment like The 606.
In order to help understand displacement risk in a neighborhood context, IHS updates the Mapping Displacement Pressure in Chicago tool annually and works with community organizations and stakeholders throughout the year to apply this work to specific initiatives and neighborhoods. Ongoing IHS initiatives build on this analysis to better understand how investment patterns, affordability, and displacement risk are impacted by housing market and socioeconomic conditions like vacant land, housing stock characteristics, proximity to amenities, and crime. IHS will also explore how a lens of displacement risk can inform other place-based community development strategies around topics such as equitable development, public health, and infrastructure investment.
About the Analysis
Recently, a growing number of studies have focused on ways to analyze data associated with lost affordability and displacement risk to help policymakers be more proactive in planning for preserving affordable housing and preventing displacement. While these analyses are not predictive, they represent a critical starting point for practitioners and policymakers to assess conditions and needs at the neighborhood level. Building on IHS's work documenting changes to the housing market along The 606, the Institute created the Mapping Displacement Pressure in Chicago tool to help facilitate proactive and data-informed conversations about displacement risk in the City of Chicago.
The foundation of the Mapping Displacement Pressure in Chicago tool is a demographic and socioeconomic segmentation analysis of the City of Chicago and a geospatial housing market analysis of current and changing conditions to identify areas where residents are vulnerable to displacement in a rising cost environment and where housing costs are rising. IHS worked with faculty and students from DePaul’s Department of Predictive Analytics to develop a clustering algorithm to identify communities with similar characteristics regardless of physical proximity. The model incorporated over 30 census tract-level data points on housing affordability, housing stock, environmental factors, and resident demographics and socioeconomic indicators associated with displacement risk. These results were intersected with analysis that classified census tracts based on current house prices and recent change in the price of housing in order to identify areas with rising costs where the underlying population is vulnerable to displacement.
For details on the data collected, project methodology, and a summary of the segmentation and housing market analysis results updated in 2018, click here. For a fact sheet summarizing trends and policy implications in high-cost, moderate-cost, and lower-cost markets as of 2018, click here. For more information on the project, or for custom technical assistance inquiries utilizing the tool, contact IHS.
This project was funded with generous support from the Polk Bros Foundation. IHS receives operating support from the John D. and Catherine T. MacArthur Foundation and the Chicago Community Trust. The PNC Bank Foundation also supports IHS's web site upgrades and data tool development. The views in this report are IHS's and do not necessarily reflect those of these funders.