The Fourth Quarter 2012 IHS Cook County House Price Index reflects house price changes on properties with repeat sales from the first quarter of 1997 through the fourth quarter of 2012. The IHS House Price Index tracks quarterly price changes for the four primary residential property types found in the County: single family homes, condominium units, small rental buildings with two to four units, and larger rental buildings with five or more units. The Index also breaks out Cook County house price changes for single family homes and condominiums in 19 submarkets located in the City of Chicago and 14 submarkets in suburban Cook County.
For a detailed description of how the IHS Cook County House Price Index is calculated, click here. For each release of the Index, tabular data is available for download. The numbers reported here are seasonally adjusted. For PDF files of all figures and maps shown, click the download link at the bottom of the page.
Data from the fourth quarter of 2012 show that prices for single family homes and condominium units in Cook County remain quite weak. Within the County, however, there is significant geographic variation in the strength of local housing markets. Segmenting Cook County single family and condominium house price changes by geographic submarket shows that even as prices remain weak overall, a few submarkets in the City of Chicago appear to have emerged from the housing crisis on relatively strong footing. At the same time, other foreclosure-distressed submarkets in the City and suburbs seem to have hit price bottoms and are showing signs of price stability and recovery. Meanwhile, the rental market in Cook County continues to show positive signs of a price recovery year over year. Despite this, prices for larger multifamily rental properties experienced a second consecutive quarterly decline, and fourth quarter price gains observed in the small multifamily rental market were largely isolated to high-value properties in stronger market.
Single family and condominium price trends
- Recent price trends in the single family market remain flat. Although single family home prices continue to show signs of stability and improvement nationally, prices in Cook County have not seen similar levels of growth and remained fairly flat in 2012. The IHS House Price Index shows that prices for single family homes were essentially unchanged year over year in the fourth quarter of 2012 (see Figure 1 for full price trend). Single family house prices in Cook County remained fairly flat throughout 2012 with limited quarter-over-quarter changes throughout the year. From their peak in 2006, prices of single family homes were down nearly 39 percent as of the fourth quarter 2012 (see Figure 2 for cumulative annual price change).
 Figure 1 - Cook County Price Changes by Property Type, 1997 to Fourth Quarter 2012
- Condominium prices continue to decline. The condominium market in Cook County remained the weakest segment of the County’s housing market. In the fourth quarter of 2012, condominium prices were down nearly 10 percent year over year and down more than two percent quarter over quarter (see Figure 1 for full price trend). Condominium prices have seen no price recovery and as of the fourth quarter of 2012 were down by over 54 percent from their peak in 2007 (see Figure 2 for cumulative annual price change).
 Figure 2 - Cumulative Annual Price Changes by Property Type in Cook County, From Price Peak to Fourth Quarter 2012
Submarket price trends
The majority of submarkets in Cook County have yet to hit a price bottom. The IHS Cook County House Price Index breaks out Cook County house price changes for single family homes and condominiums in 33 Cook County submarkets, 19 located in the City of Chicago and 14 submarkets in suburban Cook County. Recent price trends show that in the fourth quarter of 2012, prices for single family homes and condominiums in 24 of 33 Cook County submarkets were at or near their lowest point since the housing market collapse in 2007 and none have seen any recent price recovery.
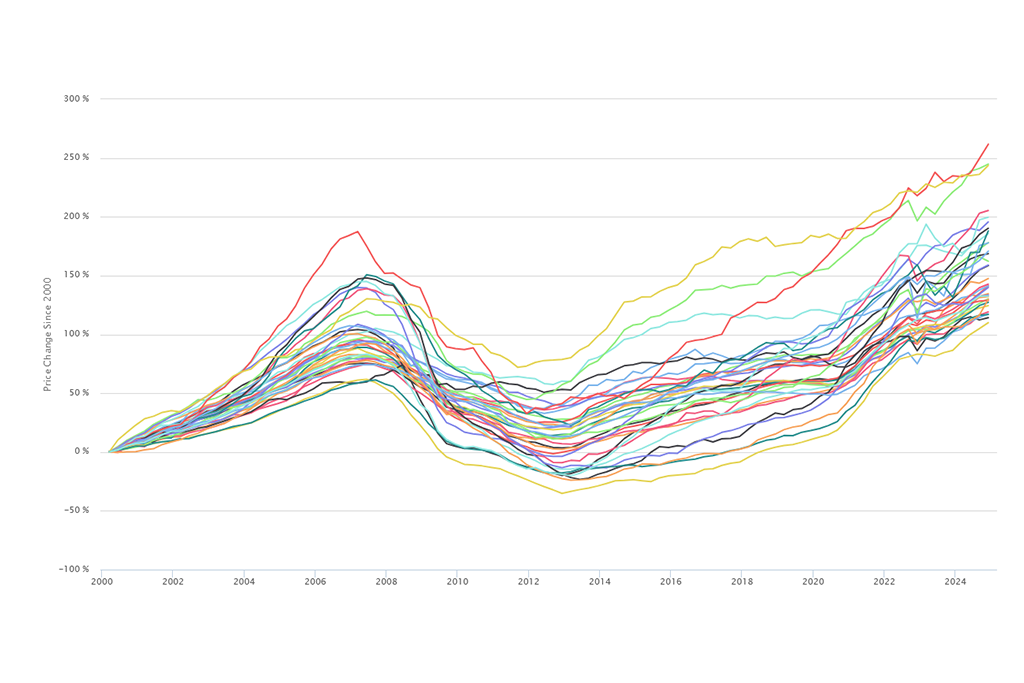
Although all the submarkets in this group have seen recent price weakness, there is dramatic variation in longer term price trends for these areas. Some of these submarkets have seen longer term price growth since 2000. For example, Bridgeport/Brighton Park has seen prices increase by 30 percent since 2000, and Lincoln Square/North Center has seen prices increase by 20 percent. Other areas have seen dramatic price declines since 2000. For example, the Calumet City/Harvey submarket has seen a 37 percent decline since 2000, and Chatham/South Shore/Woodlawn has seen prices decline by nearly 46 percent. Figure 4 charts price changes for single family homes and condominiums for each of the submarkets since 2000 and, for areas with some recent price recovery, shows positive increases since reaching a price bottom. Prices in those areas showing no recent improvements are still experiencing declines and have not yet reach a bottom. (See Figure 3 for a map of submarket locations and click here for a sortable table of submarket price trends).
 Figure 3 - Map of Cook County Submarkets by Price Trend Characteristics as of the Fourth Quarter 2012
- A small group of submarkets have emerged from the housing crisis on relatively strong footing. Four submarkets have emerged as the strongest in Cook County, exhibiting substantial price growth since 2000 while also experiencing recent price improvements. These areas are all in the City of Chicago and are clustered near the city center or along Lake Michigan. For example, prices in the Loop submarket area have increased by 36 percent since 2000, the largest of any Cook County submarket. Additionally, prices for Loop submarket single family homes and condominiums increased nearly five percent year over year in the fourth quarter of 2012. The Bronzeville/Hyde Park submarket has seen prices increase by nearly 30 percent since 2000 and saw year-over-year price increases of more than eight percent. The other submarkets showing both positive long-term growth and short-term price gains include Lakeview/Lincoln Park and West Town/Logan Square (see Figure 4 for price trends in these submarkets).
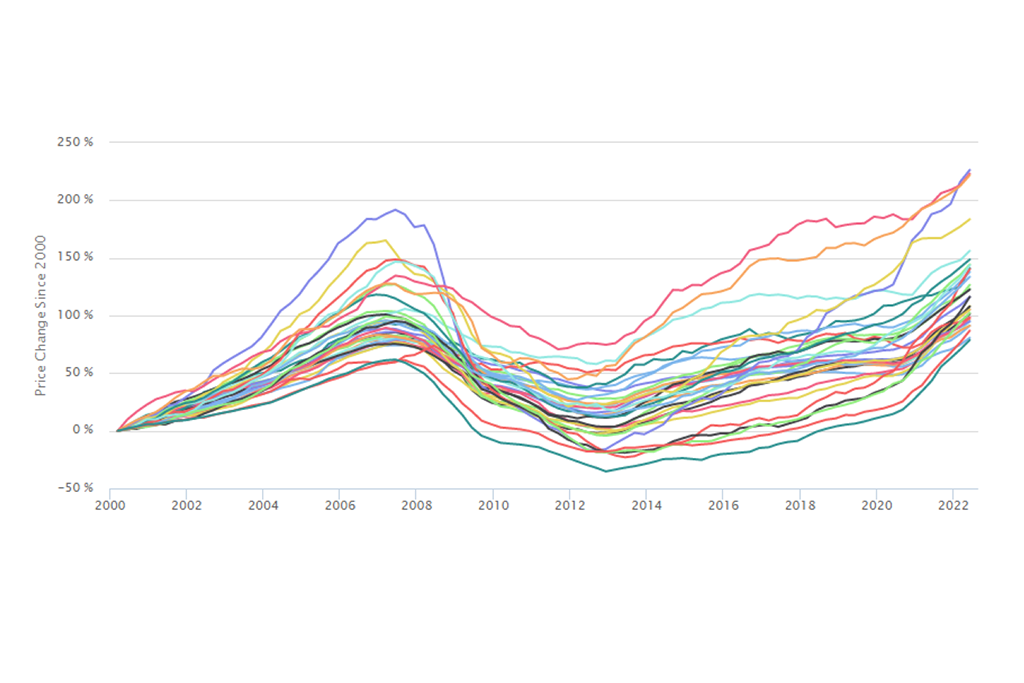
 Figure 4 - Cook County Submarket Price Changes: 2000 to Fourth Quarter 2012 and Increases Since Reaching Low Point, Fourth Quarter 2012
- Another small group of submarkets have seen price declines since 2000, but have experienced recent positive price trends. Of these submarkets, some have been among the hardest hit by the foreclosure crisis, but recent price increases are an indication that these markets may have bottomed out. For example, the Humboldt Park/Garfield Park submarket has seen price declines of more than 40 percent since 2000, but recent price trends are somewhat positive. Since reaching a bottom in the first quarter of 2012, prices in this submarket have increased by nearly four percent, and this area saw quarter-over-quarter price increases of nearly three percent. The Pullman/Roseland submarket has seen price declines of nearly eight percent since 2000 but has also seen strong recent price growth. This submarket also reached a low point in the first quarter of 2012, but in the fourth quarter it experienced a year-over-year price change of nearly 19 percent, the largest increase of all submarkets observed. Other hard hit areas with recent price improvements include Englewood/Auburn Gresham and Pilsen/Little Village. Price increases in these submarkets are largely being driven by the resale of low-value properties bought and sold in the last four years. It will be important to track how sustained these price increases are to know if they are a temporary phenomenon or if prices in these areas have truly stabilized. (See Figure 4 for price trends in these submarkets.)
Rental market price trends
- Small rental building prices continue to show some improvement, particularly those with the highest values. Prices for small rental buildings continued their positive price trends in the fourth quarter. Between the fourth quarter of 2011 and the fourth quarter of 2012, prices for small rental buildings increased by roughly two percent (see Figure 1 for full price trend). Fourth quarter price increases were largely the product of price growth in the high-value segment of the small rental property market, however. High-value small rental properties are typically concentrated in stronger markets and are benefiting from continued increases in rental demand in those areas. While these properties saw year-over-year price growth of nearly 12 percent and have experienced three consecutive quarters of price increases, prices in the fourth quarter for all small rental properties countywide remain at pre-2000 price levels.
- After a run of strong price growth, larger multifamily rental properties have experienced recent price declines. Overall, larger multifamily rental buildings continue to benefit from strong rental demand and the limited supply of new rental housing. After experiencing strong price growth throughout 2011 and the first half of 2012, large multifamily rental properties saw price declines in the third and fourth quarters of 2012 (see Figure 1 for full price trend). Despite these recent declines, prices for large multifamily rental properties ended 2012 two percent higher than they were at the end of 2011, and they have seen the strongest price recovery of all residential property types in Cook County. Prices for larger multifamily rental properties ended 2012 roughly 37 percent below their peak during the housing boom (see Figure 2 for cumulative annual price change).
Data Sources
To calculate the IHS Cook County House Price Index, the Institute uses data on property sales from the Cook County Recorder of Deeds (via Property Insight) and Midwest Real Estate Data. IHS also uses data from the Cook County Assessor's Office to determine property characteristics, price tiers, and the weighting of different types of property sales. For more information, click here.