Written to inform the development of the City's forthcoming 2014-2018 Five Year Housing Plan, the Overview of the Chicago Housing Market contains a comprehensive set of maps, charts, and tables meant to both provide background data for the city's housing plan and a comprehensive view of neighborhood housing markets. This book was used to facilitate advisory group discussions of the housing market needs of Chicago’s neighborhoods and to craft the new Five-Year Housing Plan that will guide the City’s policy and investment related to housing from 2014 to 2018.
IHS’s report, available in full as a PDF here, is meant to provide an accurate and timely picture of factors affecting Chicago’s housing market and the supply of affordable housing in particular. Data focuses on the following areas: the City of Chicago’s demographic and economic trends, the composition and characteristics of Chicago's residential housing stock, recent trends in neighborhood housing markets, and the changing dynamics of rental housing affordability in the City over the next five years.
The report contains 13 maps and more than a dozen tables and charts pulling from a variety of sources, including IHS’s Data Clearinghouse, an extensive collection of property-level data covering the city and suburban Cook County. More in-depth discussions of many of these issues can be found in previous IHS work, including the State of Rental Housing in Cook County, Cash or Credit: The Role of Cash Buyers in Cook County's Housing Market, and The Composition of Cook County's Housing Market. Additionally, detailed neighborhood-level data for many of the following maps and charts can be found at the IHS Housing Market Indicators Data Portal.
The report includes maps showing the following for the City of Chicago:
Neighborhood-level variation in demographic characteristics, including:
- Population change since 2000
- Share of population under the age of 18
- Share of population over the age of 65
Neighborhood-level economic conditions, including:
Spatial visualization of the characteristics of Chicago's housing stock, including:
- Predominant housing type by census tract
- Median age of buildings
- Median value of owner-occupied buildings by census tract
- Share of units in government-assisted housing developments by Community Area
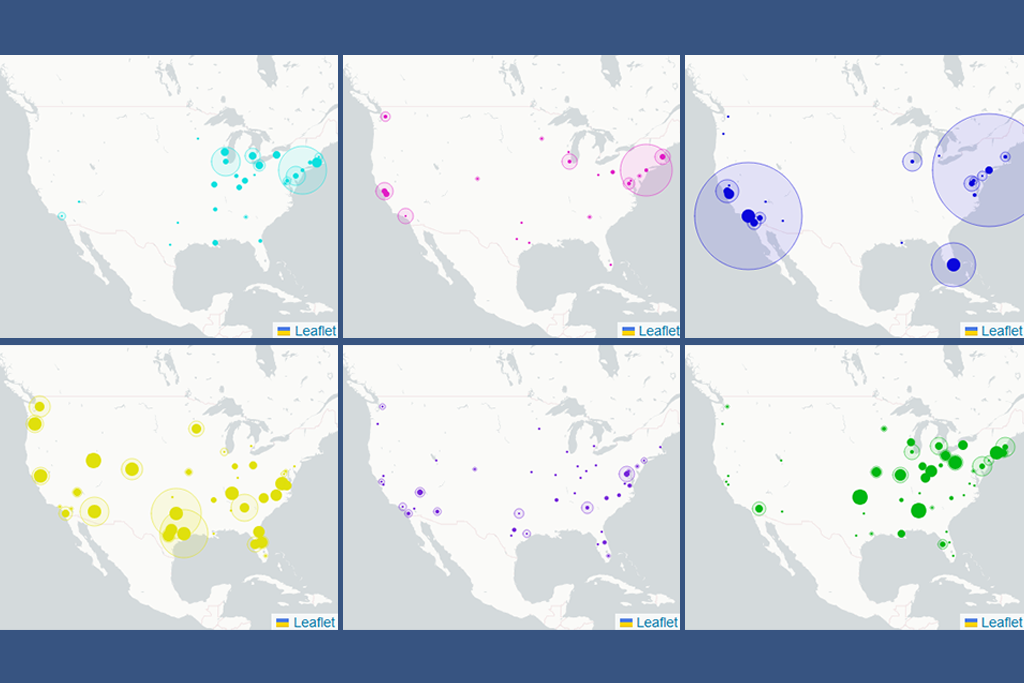
 Share of Total Housing Units in Government-Assisted Housing Developments by Community Area, Chicago. This is one of many maps available in the Overview.
As well as the following maps:
- Geographic variation in neighborhood foreclosure-distress level: the share of parcels with at least one foreclosure filing by census tract
- Predominant method of property acquisition by census tract, 2012
- Patterns of financed and cash property purchases by census tract, 2012
- Price change since 2000 by submarket based on the IHS Cook County House Price Index (submarket geography uses Public Use Microdata Areas)
Other tables and charts included in the report:
Comparisons of Chicago's demographic and economic trends and characteristic, including:
- City population compared to Chicago six-county area, 1950 to 2010
- City of Chicago population compared to top ten cities in U.S. by population, 2000 to 2010
- City of Chicago population change by race/ethnicity in city and suburban Cook County, 2000 to 2010
- Unemployment levels compared to top ten cities by population, 2011
 Share of Total Housing Units in Government-Assisted Housing Developments by Community Area, Chicago. This is one of many maps available in the Overview.
In order to examine housing trends in the context of the legacy the foreclosure crisis, IHS broke out housing trends by the degree to which a neighborhood's housing stock has been impacted by foreclosure between 2005 and 2011. To do this, neighborhoods were separated as follows:
- Low foreclosure: 10 percent or less of all parcels had at least one foreclosure filing between 2005 and 2011
- Moderate foreclosure: 10 to 24.9 percent of parcels had at least one foreclosure filing between 2005 and 2011
- High foreclosure: Greater than 25 percent of parcels had at least one foreclosure filing between 2005 and 2011
Then in charts and tables, the report examines the following market trends broken out by these neighborhood foreclosure-distress levels:
- Properties entering Real Estate Owned (REO) status per 100 residential parcels, 2000 to 2012
- Addresses that were vacant for 24 months or more, 4Q2012
- Annual property sales by acquisition method, 2005 to 2012
- Property sales by acquisition method and type of purchase, 2005 to 2012
- Share of non-condominium sales less than $20,000, 2005 to 2012
- Share of single family and condominium sales purchased by self-identified business buyers, 2005 to 2012
Finally, the Overview includes an examination of changes in renter and owner occupancy and the growing gap between the supply of and demand for affordable rental housing within the City of Chicago. It does this with the following graphs and tables:
- Share of renters who can affordably pay for a median-priced single family home in the community by City of Chicago submarket, 2012
- Net change in households by tenure in City of Chicago Submarkets, 2007 to 2011
- Gap between demand for and supply of affordable rental housing in Chicago, 2007, 2009, and 2011
- Change in cost-burdened households by income level and tenure choice, 2007 to 2011
- Estimated gap between supply of and demand for affordable rental housing in different economic growth scenarios, 2011-2020
This report provides a comprehensive picture of the dynamics of Chicago's housing market and adds to a better understanding of the housing needs of the City's neighborhoods. Look for more in-depth discussion on the IHS Blog of how these data and analysis can used by practitioners for the development and targeting of housing and community development strategies, and give us feedback or ask questions via email or twitter.