Articles tagged 'Maps'
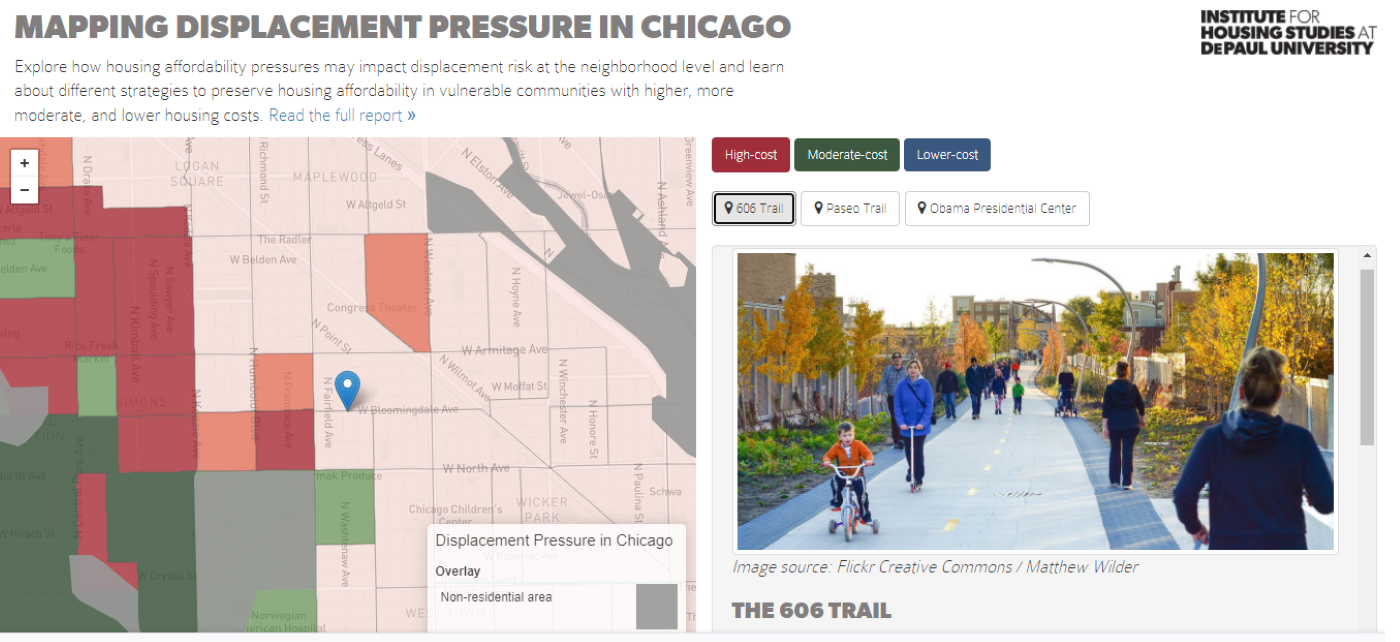
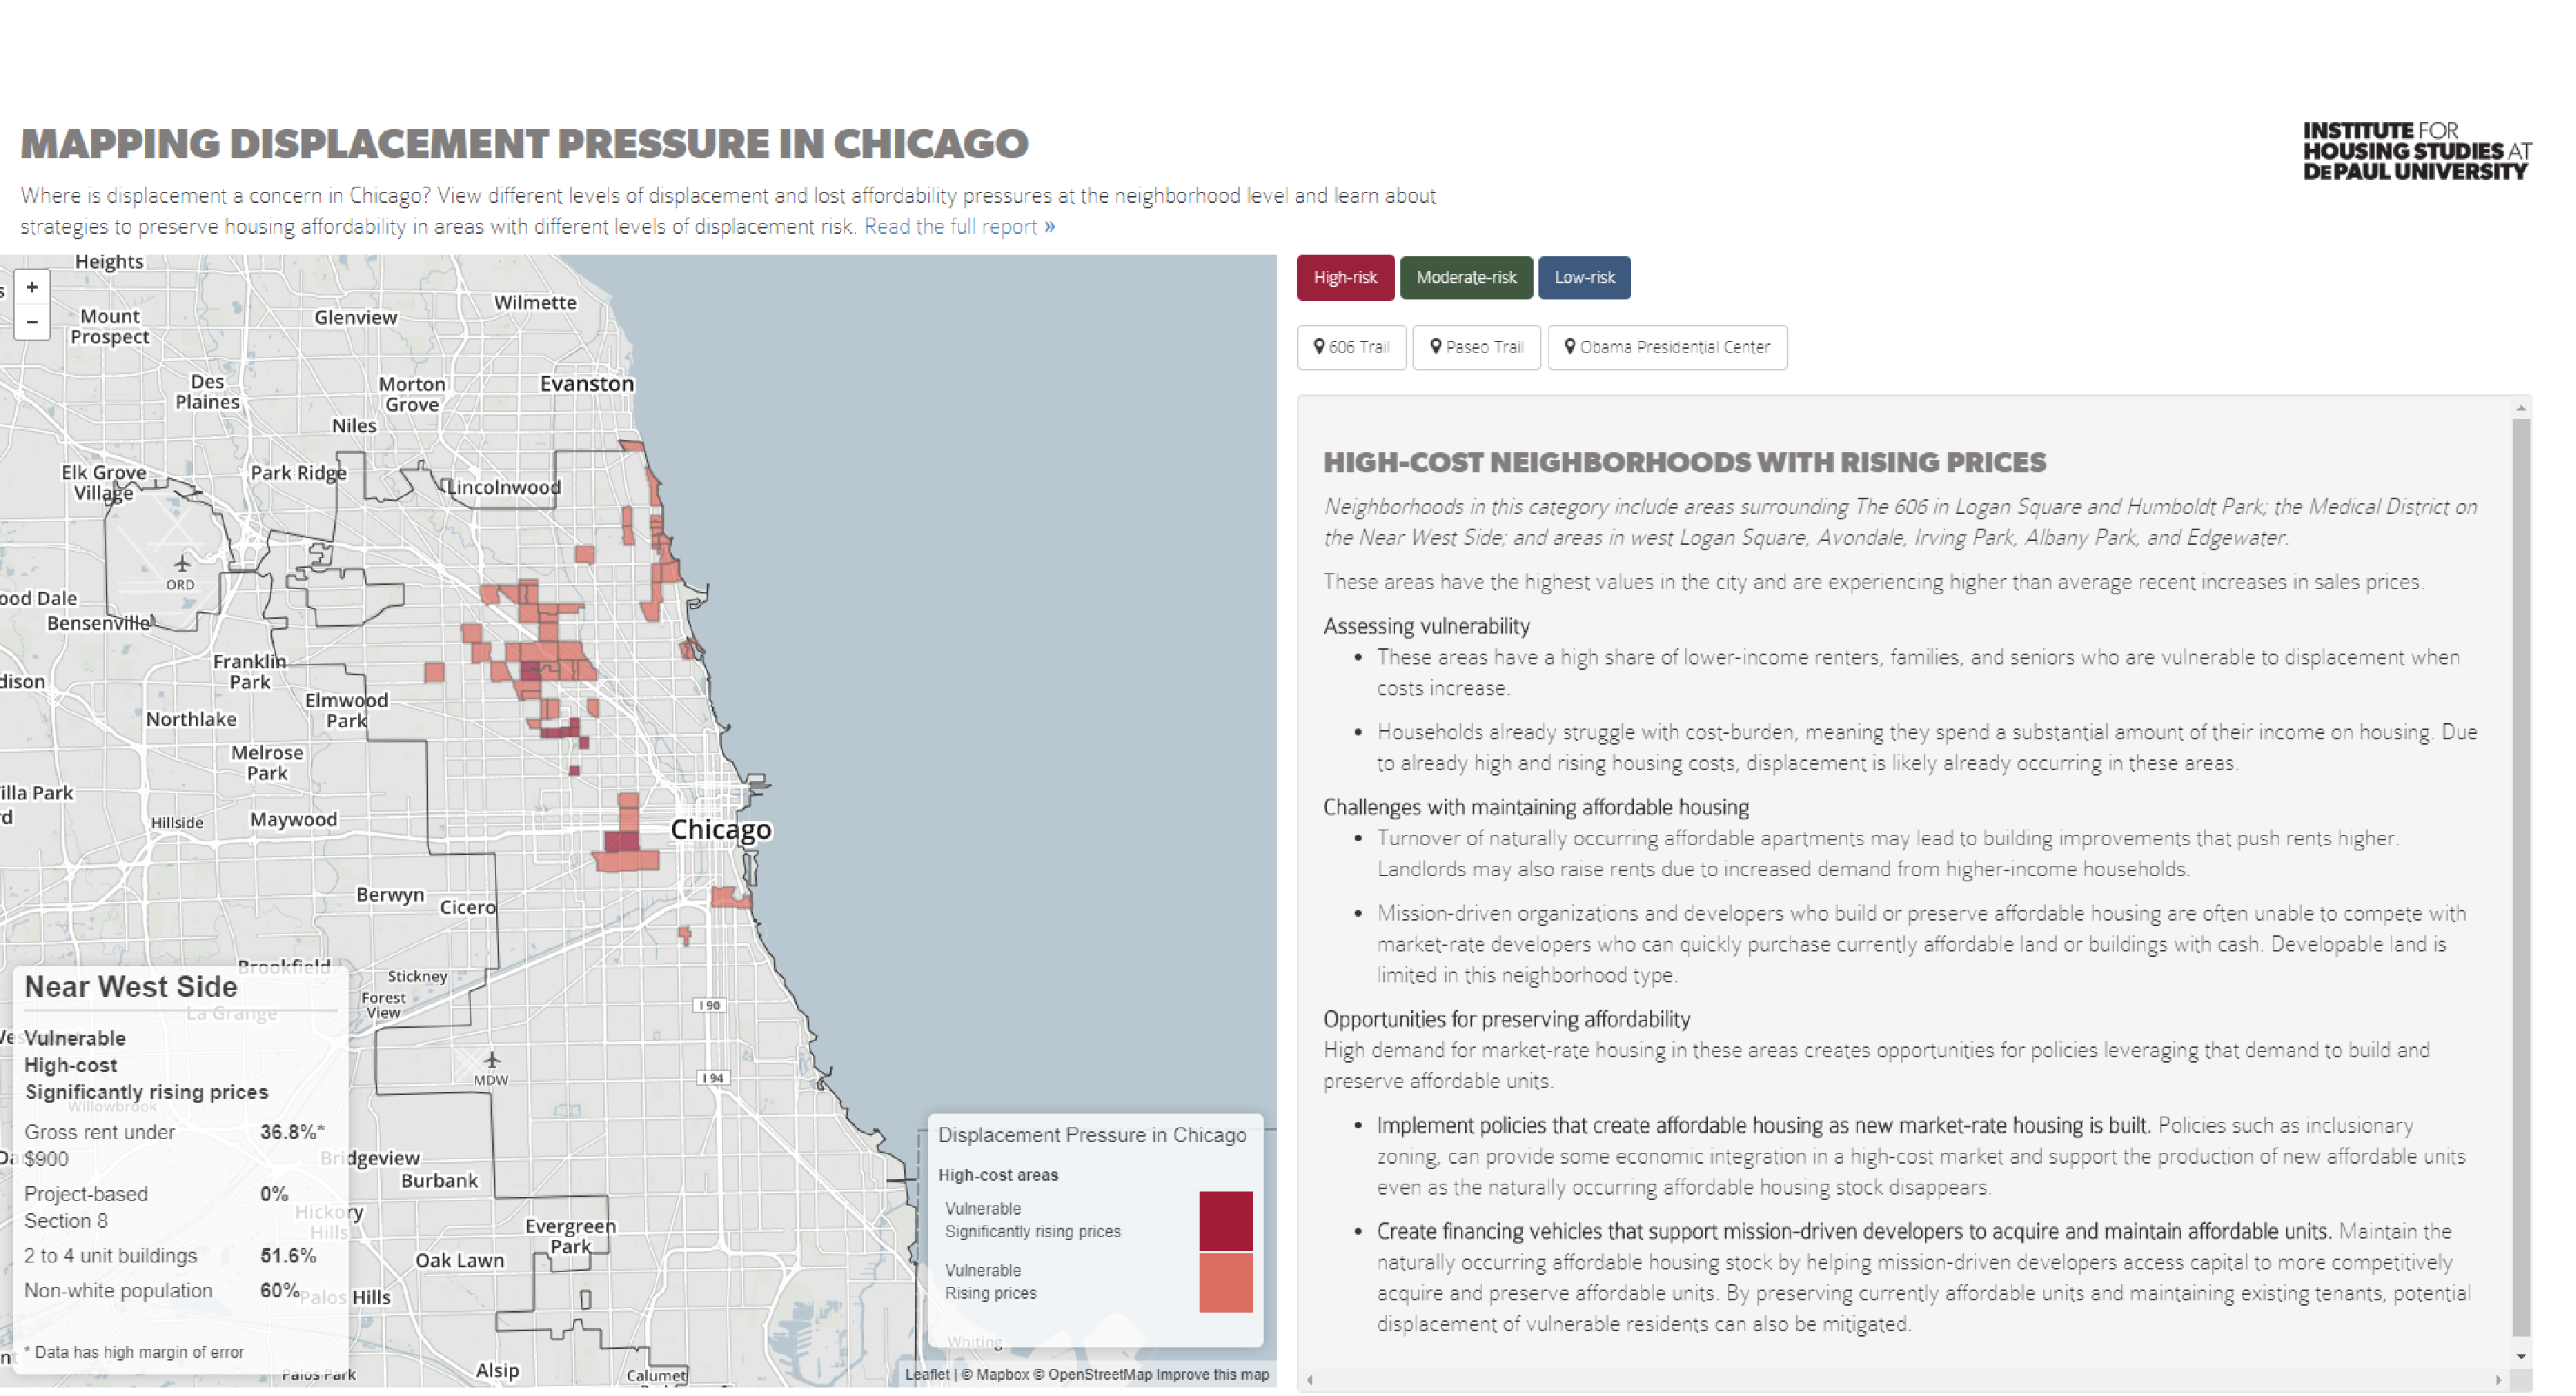
Mapping Displacement Pressure in Chicago, 2021
IHS’s Mapping Displacement Pressure in Chicago project supports ongoing and future public investment decisions by creating a leading indicator to identify neighborhoods where vulnerable populations may be experiencing affordability pressures and displacement risk from increased housing costs.
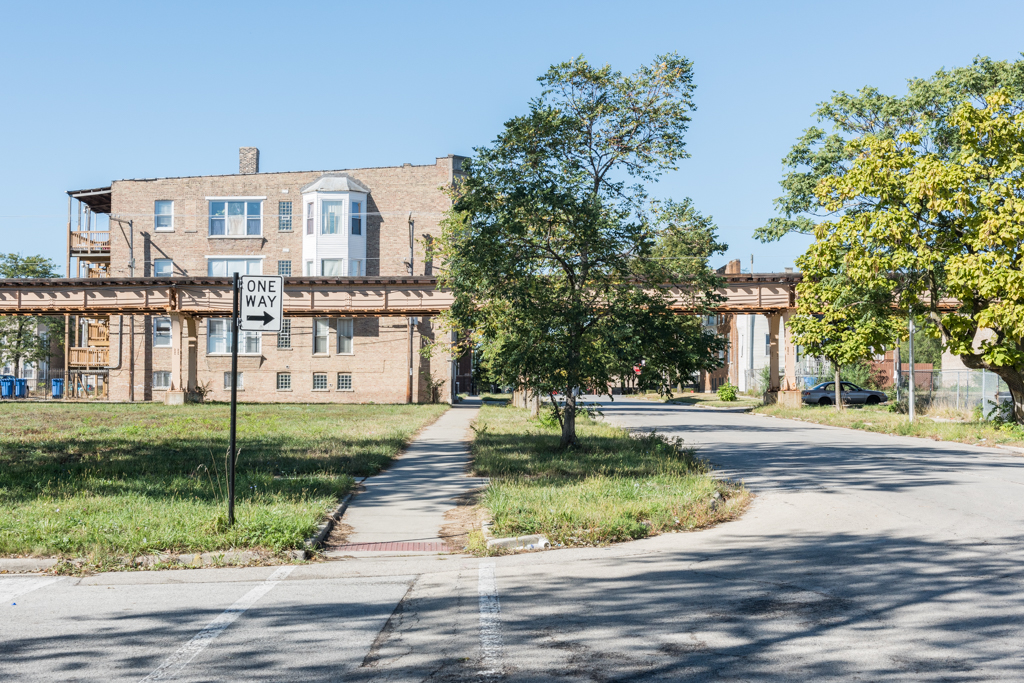
Patterns of Lost 2 to 4 Unit Buildings in Chicago
This analysis uses a unique data set to document the loss of the 2 to 4 stock in Chicago neighborhoods in an effort to understand the different ways that market forces put pressure on this key segment of the city’s housing market.
New Stories Added to Mapping Stories of Neighborhood Change Tool
IHS recently updated our Mapping Stories of Neighborhood Change mapping tool to include neighborhood news stories published in 2020 mapped alongside our updated Mapping Displacement Pressure data. The mapping tool provides users with spatial, housing market, and demographic context and to assess the potential implications of the activities described in each article.
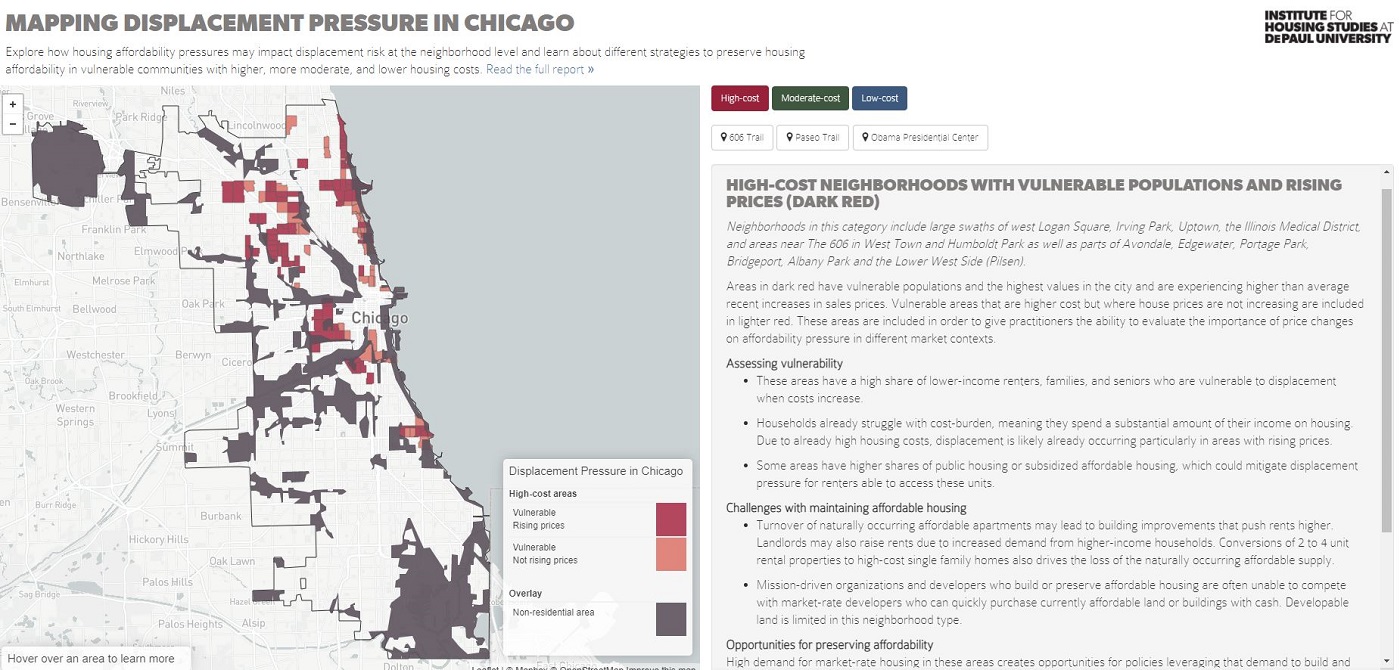
Mapping Displacement Pressure in Chicago, 2020
IHS’s Mapping Displacement Pressure in Chicago project supports ongoing and future public investment decisions by creating a leading indicator to identify neighborhoods where vulnerable populations may be experiencing affordability pressures and displacement risk from increased housing costs.
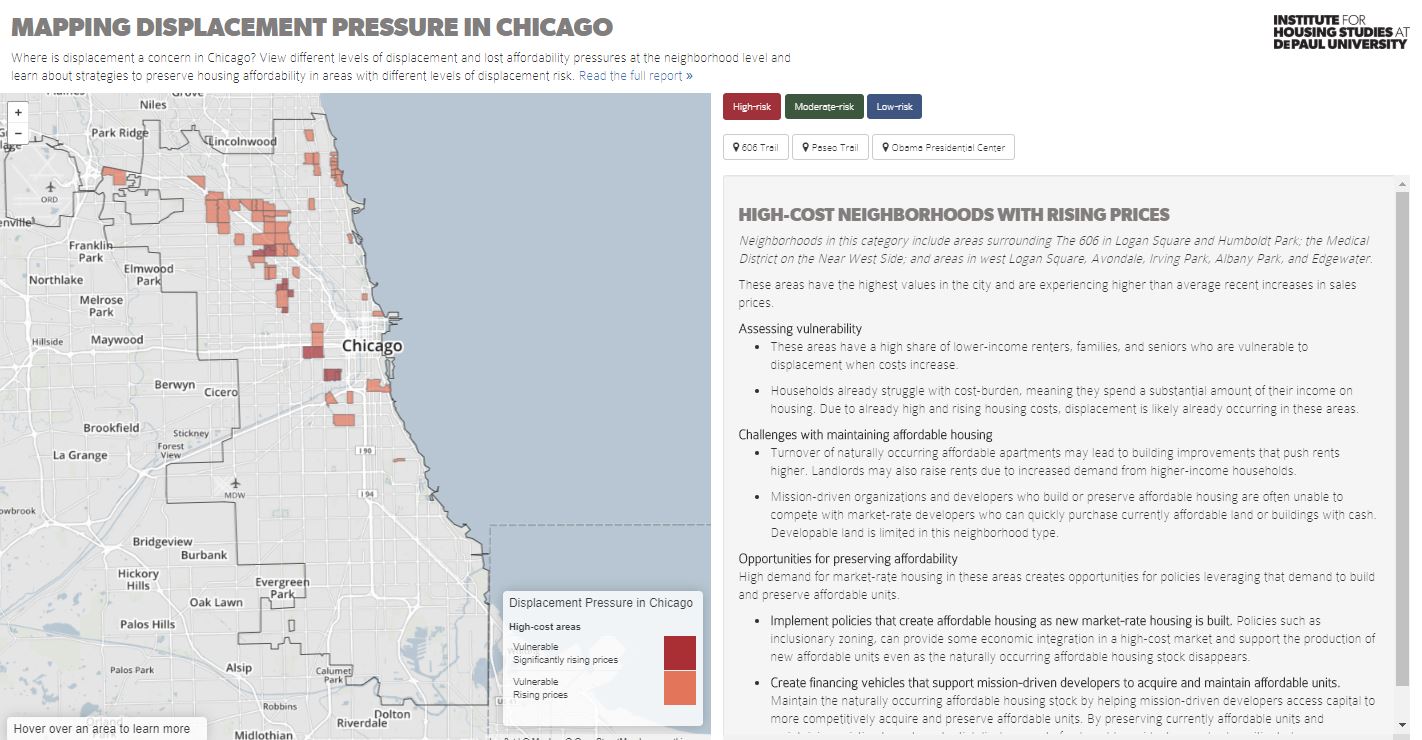
Mapping Displacement Pressure in Chicago, 2019
IHS’s Mapping Displacement Pressure in Chicago project supports ongoing and future public investment decisions by creating a leading indicator to identify neighborhoods where vulnerable populations may be experiencing affordability pressures and displacement risk from increased housing costs.
Mapping Stories of Neighborhood Change
IHS has mapped stories in the Chicago media highlighting neighborhood real estate investments, announcing new development projects, or describing the ways the neighborhood residents are responding to changes in their communities.
Understanding the Relationship between Opportunity Zones and Displacement Pressure in Chicago
This blog highlights how Chicago’s designated Opportunity Zones align with displacement pressure in the city’s neighborhoods and discusses what this means for the implementation of Opportunity Zone investments.
Analyzing Neighborhoods with Intensifying and Emerging Housing Affordability Pressure
This analysis examines IHS’s updated displacement pressure maps and ways that market pressure may be changing in Chicago neighborhoods. The goal is to give neighborhood stakeholders a timely resource to understand shifting levels of market activity and highlight which areas in the City of Chicago may be experiencing increased displacement pressure.
Mapping Displacement Pressure in Chicago, 2018
IHS’s Mapping Displacement Pressure in Chicago project supports ongoing and future public investment decisions by creating a leading indicator to identify neighborhoods where vulnerable populations may be experiencing affordability pressures and displacement risk from increased housing costs.
Why Some Chicago Neighborhoods Are Losing Their Children
Since 2010, the number of children in Chicago declined by 40,000. Chicago ranks near the top of cities in the nation for child population declines, right behind Cleveland and Detroit.
