The newest release of the State of Rental Housing in Cook County updates key data on changing rental demand, the supply of rental housing, and how these dynamics are affecting access to affordable rental housing for Cook County's lowest income households. The report focuses on conditions in 2016, the most recent data available from the American Community Survey, and compares data to trends reported in previous IHS reports. This report also includes data on affordable rental demand and rental market affordability for 34 submarkets in the City of Chicago and suburban Cook County.
For information on data sources and methodology, click here. To access the data behind the figures in the report, click here. For more on how these data connect to local and national housing and community development policy issues, see the affordability series on the IHS blog.
Key trends in rental demand:
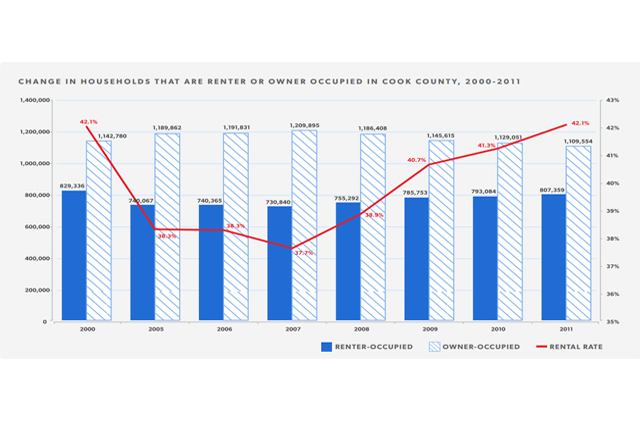
Cook County's rental rate stabilizes after years of growth
The rental rate in Cook County, which had been climbing in the years following the recession, now appears to be leveling out. This matches the national trend showing a slow down in renter household growth over the last year. The charts below show the change in the share of Cook County households that were renters between 1990 and 2016 and the number of households that rented or owned during this same period. During this period, the number of owner households increased by 10,366 while the total number of renter households dropped by roughly 1,100. Despite these shifts, the rental rate continues to be historically high with the 2016 rental rate just 0.6 percentage points below the last significant peak set in 1990 and the total number of renter households higher than levels in 1990.
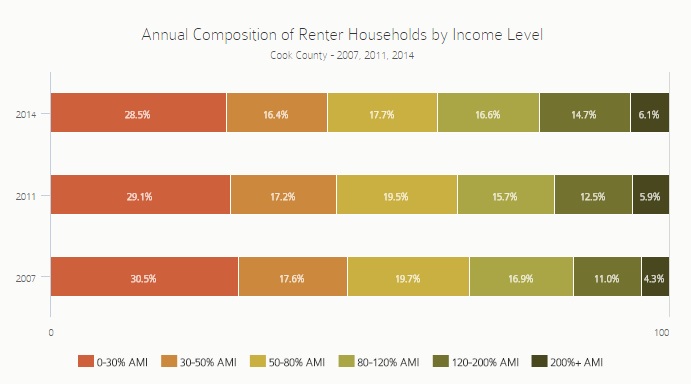
Higher-income renters continue to increase in Cook County
Previous State of Rental Housing in Cook County reports have documented how the number and composition of renters by income level changed throughout the recession and recovery period. Between 2007 and 2012, the county experienced growth in renter households across all income groups, especially very low-income renters and higher-income renters earning more than 120 percent AMI. As the economy improved after 2012, the number of very low-income renter households declined slightly then stabilized while increases in higher-income renter households continued year after year. This trend has led to shifts in the composition of renter households by income level with significantly more renter households earning more than 120 percent of AMI in 2016 than in 2007 and in 2012.
Despite these shifts, very low-income households continue to represent the largest share of Cook County renter households. In 2016, 27.9 percent of renter households earned less than 30 percent AMI compared to 21.7 percent of renter households who earned more than 120 percent AMI. In 2016, renters earning less than 30 percent AMI earned less than $19,806 while renters earning 120 percent or more of AMI earned at least $79,224. The median household income in 2016 for the Chicago Metropolitan Statistical Area was $66,020.
Declines in renters aged 35 to 44 may indicate a shift to homeownership
The charts below illustrate the number of renters by age group (determined by the age of the head of the household) as well as the composition of renters by age in 2007 and annually between 2012 and 2016. Just as the recession and recovery period led to changes in the composition of renters by income, the composition of renters by age group also shifted during this period. For example, previous IHS State of Rental Housing reports documented that the large growth in renter households between 2007 and 2014 was largely driven by younger households while last year's report noted steady annual increases in the number and share of renter households over 55. While these trends largely held through 2016, a slight dip in the number of renter households aged 35 to 44 may indicate a transition for this age group into homeownership -- this decrease was more than offset by a 10,374 increase in owner-occupied households aged 35 to 44. The number of renter households in the 35 to 44 age category is estimated to have dropped by 7,731 between 2015 and 2016—a 4.2 percent decrease.
Key trends in rental supply:
Declines in the number of rental units in two-to-four unit buildings slow, but the stock remains at historically low levels
Despite the importance of two-to-four unit buildings to Cook County's stock of affordable rental housing, several recent IHS reports have documented that the number of two-to-four's in the county is shrinking. There is evidence that this stock is facing pressures at the top and bottom, losing units both through deterioration, vacancy, and demolition in weaker markets and through conversion to single family homes in stronger markets. Despite a slight increase in the number of rental units in two-to-four unit buildings between 2015 and 2016, the overall number and share of total rental units in two-to-four unit buildings remains significantly below historic levels. Between 2013 and 2016, the number of rental units in two-to-four unit buildings dropped by 6,832 units or 2.4 percent and is the only building type to see declines in units during this period. Meanwhile, single-family rental homes have represented an increasing share of Cook County’s rental stock. In Cook County, rental units in single-family homes increased by 6.2 percent since 2013.
Key trends in rental affordability:
In Cook County, the rental affordability gap narrowed due to declining demand for affordable units
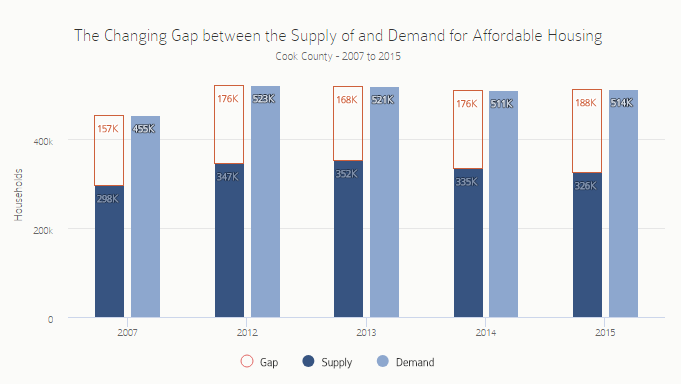
Throughout the recession and recovery period, IHS has documented the mismatch between the number of households in Cook County that need affordable rental housing and the number of units that are affordable. This “affordability gap” is defined as the difference between the demand for affordable rental housing by lower-income households earning 150 percent of poverty and the supply of units that would be affordable at 30 percent of a lower-income household’s income—about $910 per month. Because an affordable rental unit can be occupied by a household earning above 150 percent of poverty, higher income households that occupy a unit affordable to a household earning 150 percent of poverty are also included in this demand calculation.
The chart below examines levels of affordable rental demand and supply, and highlights the pre-recession affordability gap in 2007 and annually between 2012 and 2016. After hitting a high of 187,848 units in 2015 the affordability gap in Cook County dropped to 181,794 units in 2016. This decline is largely attributed to a decreasing demand for affordable rental units as lower-income households leave Cook County or increase their incomes, or as higher-income households move out of rental housing that is affordable to lower-income households. During this period affordable demand decreased by 15,844 households while the supply of affordable units declined by roughly 9,800 units. Despite declines in the affordability gap between 2015 and 2016, the gap is still 15.6 percent higher than in pre-recession 2007 and in every other year after 2012 but 2015.
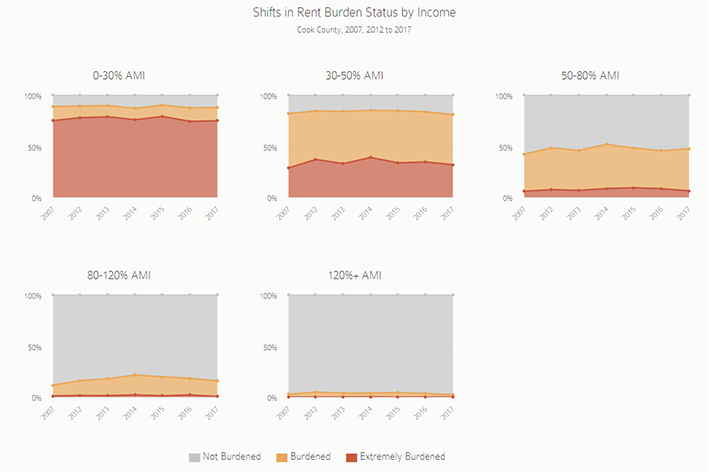
High shares of low-income renters continue to be rent burdened
The chart below shows the rent burden status of Cook County households by income level pre-recession in 2007, and annually between 2012 and 2016. Overall, the number and share of households that are rent burdened, or pay in excess of 30 percent of their incomes towards rent, declined for every income group between 2015 and 2016 -- which may be associated with declining affordability gap observed countywide. The decreases were slight, however. In 2016, roughly half of all renter households in Cook County and the vast majority of lower income households continue to be rent burdened. In 2016, roughly 84 percent of households earning between 30 and 50 percent AMI and 87.5 percent of households earning less than 30 percent AMI were rent-burdened. A large percentage of households earning less than 30 percent AMI are categorized as severely rent-burdened with roughly 74 percent paying more than 50 percent of their income on rent. These figures have held relatively steady since 2012 and illustrate the persistently large number of Cook County renter households living in financially vulnerable positions.
Rental affordability gap trends diverge in the City of Chicago and in Suburban Cook County
Despite a countywide dip in the affordability gap, the City of Chicago and Suburban Cook County experienced very different affordability trends. The chart below compares the change in affordable rental demand and supply between 2015 and 2016 for the City of Chicago and Suburban Cook County. It shows that the overall decline in the affordability gap in Cook County has been led by a sharp decline in demand for affordable rental housing in the suburbs. Between 2015 and 2016, there were 9,378 fewer households considered to be demanding affordable rental housing in suburban Cook County. In the suburbs, this decline in affordable rental demand outpaced a 1,566 unit decline in the supply of affordable rental units which led to an overall drop in the affordability gap. During this period, overall demand for rental housing also declined in the suburbs. Conversely, the affordability gap grew in the City Chicago where overall rental demand increased. The loss of affordable rental units in the City of Chicago declined at a greater rate than observed declines in demand, which led to a small increase in the affordability gap in 2016. The second chart below illustrates the supply of affordable rental units relative to demand indexed to values in 2012. It shows that the supply of affordable rental units has been dropping at an increased rate in the City since 2012. Between 2012 and 2016, affordable rental demand in Chicago declined by 4.8 percent while affordable supply declined by 10.4 percent. For annual numbers on affordable demand and supply and the affordability gap for the City and suburbs, see the data appendix.
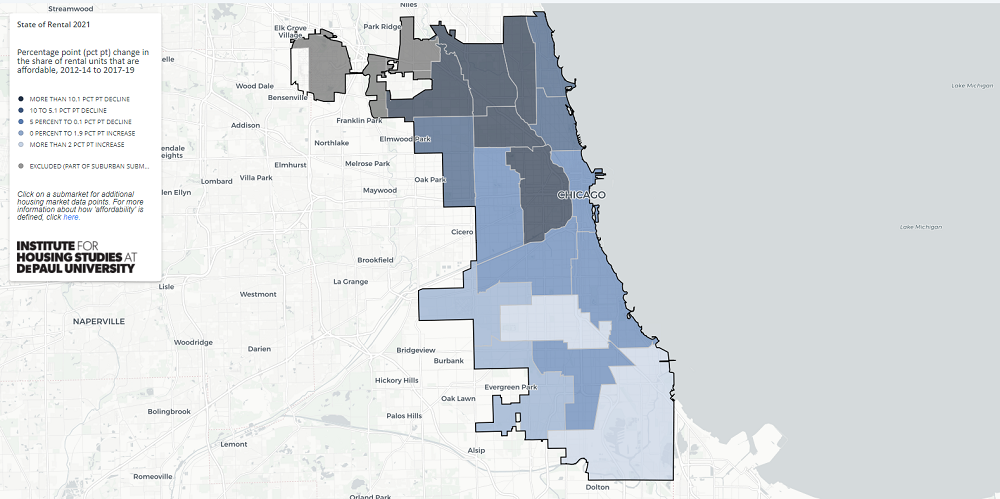
The affordability gap persists in areas with high concentrations of low-income households
The interactive map below illustrates the variation in the gap between the demand for and supply of affordable rental housing for 34 submarkets in Cook County. Areas with large affordability gaps are those where lower-income households most outnumber the supply of units with affordable rents. In areas with an already large supply of affordable units where the gap is driven by very high levels of lower-income households, the policy recommendation would likely not be to build more units but to help stabilize lower-income households through increased access to voucher-based subsidy or through workforce strategies to increase incomes.
The map shows that a cluster of south side Chicago neighborhoods that include Hyde Park, South Shore, Woodlawn, and Washington Park have the largest affordability gap in Cook County. This submarket has the largest number of affordable units (roughly 32,000 units), as well as the highest demand for affordable rental housing from low-income households (roughly 47,800 renter households). Consistent with IHS’s 2017 State of Rental Housing in Cook County report, the west side submarket covering Humboldt Park, East/West Garfield Park, and North/South Lawndale and the north side submarket which includes Uptown and Rogers Park continue to also have large affordability gaps. To access a full-screen version of the map, click here.