The newest release of the State of Rental Housing in Cook County updates key data on changing rental demand, the supply of rental housing, and how these dynamics affect access to affordable rental housing for Cook County's lowest income households. The report focuses on conditions in 2017, the most recent data available from the American Community Survey, and compares data to trends reported in previous IHS reports. New this year, the report also includes an in-depth, submarket-level analysis examining changes in the affordable rental housing supply and its implications for lower-income renters, and how these changes vary across the City of Chicago. Summary data for Cook County, the City of Chicago, and suburban Cook County are featured in the appendix.
This year’s State of Rental Housing in Cook County sees substantial shifts in demographic groups that have been key drivers of growing rental demand in the county. At the same time, the loss of the affordable rental housing supply in Chicago means that more lower-income renters are in higher-cost units. The data show a substantial drop in low-income renters in the city and in suburban Cook County. This drop in low-income renters is not offset by increases in homeownership or shifts to higher- or lower-income levels, highlighting ongoing concerns that the loss of affordable rental housing may be contributing to low-income renters leaving the city and county.
For information on data sources and methodology, click here. To access the data behind the figures in the report, click here. For more on how these data connect to local and national housing and community development policy issues, see The Preservation Compact’s 2019 Response to the State of Rental Housing in Cook County and the IHS blog.
KEY TRENDS IN RENTAL DEMAND
After years of growth, Cook County's renter rate falls for the second year in a row but remains historically high
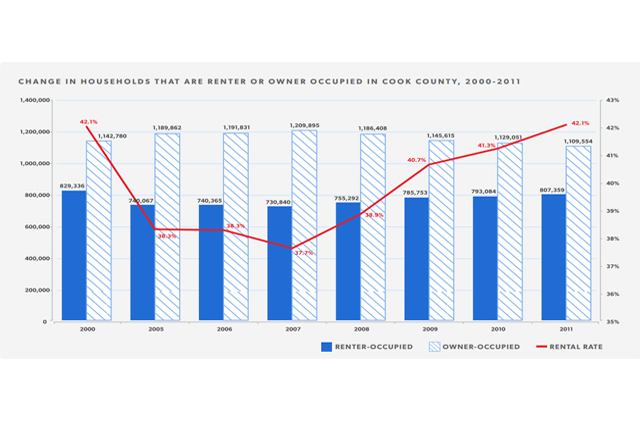
Following national trends, rental demand has recently declined after a period of steady growth. The foreclosure and economic crisis beginning in 2007 started a period of increased rental demand as more households opted to rent, either by choice or because they could not access homeownership. Similarly, as the economy has improved, demand for homeownership has increased. Over the last two years, Cook County has seen a decline in the share of households that rent. The chart below highlights that, after peaking in 2015, the number of renter households in the county decreased by 20,911 in 2017 while owner households increased by 14,759. The difference between the loss of renter households and gain in owner households reflects the modest loss in total households during this same period.
Despite recent declines, the rental rate for Cook County remains near historic highs. The rental rate is the percentage of total households that are renting in the county and reflects the relationship between the number of owner and renter households. The rental rate increased after 2007 until hitting its highest point in a decade at 44.2 percent in 2015. The rental rate then decreased slightly in 2016 and again in 2017. The 2017 rental rate of 43.3 percent is just 0.9 percentage points below the 2015 peak and 5.6 percentage points higher than the rental rate in 2007, however. To access the data behind these figures and examine trends after 2012 in the City of Chicago and in Suburban Cook County, see the appendix.
Behind a declining rental rate are fewer low-income and, recently, higher-income renter households
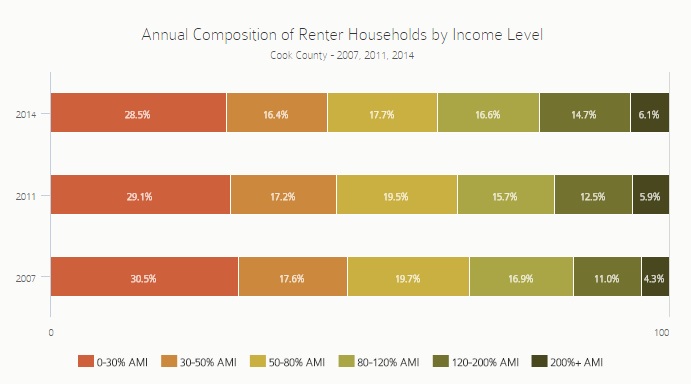
Last year’s State of Rental Housing in Cook County report noted that Cook County saw significant growth in the number of higher-income renter households during the recession and recovery periods. The charts below illustrate the number of renters by household income group as well as the composition of renters by household income group in 2007 and annually after 2012. While rental demand increased for nearly every income group during the recession and recovery periods, much of the county’s growth in rental demand came from higher-income renter households earning more than 120 percent of the area median income (AMI). However, between 2016 and 2017, 16,849 fewer higher-income renter households rented– a 9 percent drop from 2016. This leveling-off of higher-income renters may relate to more mobility for higher-earning households, a shift to homeownership, or fluctuations in income. Although the number of higher-income renter households has declined slightly year-over-year, levels in 2017 remain 4.6 percent higher than in 2012 and 52.4 percent higher than in 2007. Additionally, renter households that earn more than 120 percent AMI continue to represent the second highest share of all renter households at 20.2 percent.
In addition to these recent declines in higher-income renter households, the county saw a fairly substantial decline in low-income renter households earning between 30 and 50 percent AMI. Since 2015, 28,832 fewer households in this income group rent in Cook County - an 18.2 percent decline. While the data show that a small number of the households at this income level may have shifted to homeownership and others may be earning higher or lower incomes, there are concerns that many may have left the county. This loss of low-income households compliments recent research that some neighborhoods in the city may be increasingly out of reach for lower-income families as well as the impact of long-term disinvestment on population levels and opportunity in lower-cost communities. IHS research has shown that population is shrinking in lower-cost areas of Chicago and lower-income families are leaving the city, regardless of market type.
Despite these shifts, lower-income households continue to represent the largest share of Cook County renter households although these households are increasingly very poor. In 2017, 29 percent of renter households earned less than 30 percent AMI, a share that has been relatively stable in Cook County since 2007 but has increased since 2015. In 2017, households earning less than 30 percent AMI earned less than $20,521, households earning between 30 and 50 percent AMI earned between $20,521 and $34,201, and households earning 120 percent or more of AMI earned at least $82,084. The median household income in 2017 for the Chicago Metropolitan Statistical Area was $68,403.
The number of older renters continues to increase while millennial-aged renters decline
The charts below illustrate the number of renters by age group (determined by the age of the head of the household) as well as the composition of renters by age in 2007 and annually after 2012. Previous State of Rental Housing in Cook County reports documented that growth in rental demand during the recession and recovery period was driven initially by increases in younger renter households and later by renters over 55.
By 2015, millennial renter demand began to flatten and in 2017, decrease, while rental demand from older households continued to grow each year. In fact, rental demand between 2016 and 2017 declined for households of every age group except households age 55 and over. The biggest decline of any age group in Cook County was in the 25 to 34 age bracket, which lost 17,488 renter households between 2016 and 2017. The number of renter households in this age group is now below 2012 levels, but still significantly higher than levels in 2007. While the data show that some millennial households shifted to homeownership, declines in this demographic group indicate that new millennial households are not replacing millennials leaving the county or those aging into the 35 to 44 bracket.
These data match statewide trends—the Joint Center for Housing Studies reports that Illinois is among the five states reporting the greatest loss of millennial-aged 25- to 34-year-olds between 2012 and 2016. Other recent research has highlighted that many Chicago millennials, particularly African Americans, want to leave the city.
Similarly, the increase in older renter households matches the national trend—the aging of the Baby Boomer generation has made the 65 to 74 age group the fastest growing age group in the nation. In Cook County, the 65 to 74 age group has 30.1 percent more renter households in 2017 than in 2012. Renters over 55 now account for 30 percent of the overall rental market.
KEY TRENDS IN RENTAL SUPPLY
The number of rental units in two-to-four unit buildings continues to decline
The charts below show that in Cook County rental units in two-to-four unit buildings have steadily decreased over the last six years. Whereas units in two-to-four unit buildings represented 35.7 percent of the county’s rental stock in 2007, only 29.5 percent of the stock was in two-to-four unit buildings by 2017. The loss is significant for housing affordability— these units are a valuable source of affordable rental housing and are being lost to deterioration, vacancy, and demolition in weaker markets and through conversion to single-family homes in stronger markets. Since 2012, there has been a loss of 29,212 rental units in two-to-four buildings, a 9.8 percent decline. A portion of these rental units have changed from renter-occupied units to owner-occupied units, however. For example, the number of rental units in two-to-four unit buildings declined by 13,954 units between 2016 and 2017, but this decline was offset by an increase of 6,915 owner-occupied units in two-to-four unit buildings during this same period.
Meanwhile, the number of rental units in single-family homes appears to be stabilizing after a period of growth between 2012 and 2015. The number of rental units in single-family homes decreased between 2016 and 2017, but levels are still significantly above 2012 figures. For example, single-family rentals decreased 2.3 percent year-over-year in 2017, but are up 12.4 percent since 2012.
KEY TRENDS IN RENTAL AFFORDABILITY
Countywide, changes in the affordability gap continue to be driven by reduced demand for affordable rental units
Throughout the recession and recovery period, IHS has documented the mismatch between the number of households in Cook County that need affordable rental housing and the number of units that are affordable. This “affordability gap” is defined as the difference between the demand for rental housing by lower-income households earning 150 percent of poverty, or $37,641 annually, and the supply of units that would be affordable at 30 percent of a lower-income household’s income—about $940 per month. Affordable demand also includes renter households earning more than 150 percent of the poverty level, but live in affordable units.
The affordability gap is useful as a broad indicator to highlight the mismatch between the supply of and demand for affordable rental housing countywide, but the affordability gap does not necessarily directly translate to the number of units that need to be built to solve the region’s affordability challenges. Rather, a range of policy interventions are needed to address this issue including helping to stabilize lower-income households through increased access to voucher-based subsidy, new construction of affordable units in stronger markets, and different innovative solutions to preserving existing affordable units in neighborhoods with a shrinking affordable supply.
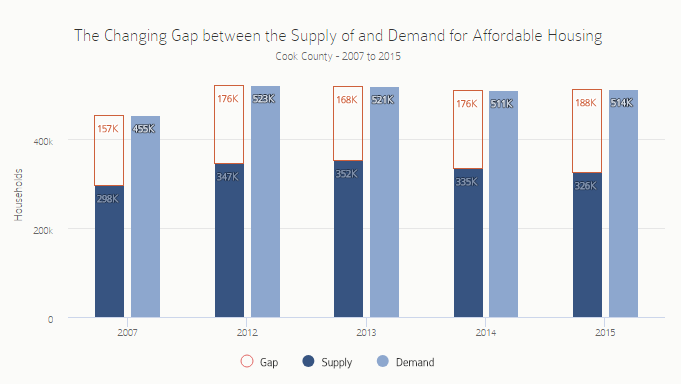
The chart below shows levels of affordable rental demand and supply and highlights the pre-recession affordability gap in 2007 and annually between 2012 and 2017. It shows that the affordability gap in 2017 continued to decline after reaching its peak in 2015, but remains elevated compared to levels in 2007 and in 2012. Since 2015, the affordability gap has declined primarily due to a loss of lower-income households in Cook County. Between 2015 and 2017, affordable demand declined by 26,479 households while the supply of units that were affordable to these households declined by 19,016 units. While it is likely that fewer lower-income households are at least partially a product of improved economic conditions, it is also likely that some of these households have left the county either by choice or because of declining affordability. Factors behind changes in the affordability gap differ between the City of Chicago and suburban Cook County. As discussed in last year’s report, persistent declines in the affordable rental supply were a key factor in the City of Chicago’s growing affordability gap. Below, further analysis and new data highlight the City’s affordability gap in more detail.
Annual data on the supply and demand of affordable units and the affordability gap in Cook County, and separately for the City of Chicago and Suburban Cook County are included in the appendix.
A large number of Cook County renter households continue to live in financially vulnerable positions.
The charts below illustrate the changing nature of rent burden for Cook County households by income level pre-recession in 2007, and annually between 2012 and 2017. The number of households in Cook County that are rent burdened, or pay in excess of 30 percent of their incomes towards rent, reached its peak in 2015 when overall rental demand was at its highest. Since 2015, the number of rent-burdened households has declined each year. While levels of rent burden lessened for nearly all income groups, much of this decline can be attributed to declining rent burden for households earning between 30 and 50 percent AMI. Between 2015 and 2017, 29,282 fewer renter households in this income group paid unaffordable rents. While some of these renters may have found more affordable housing situations, data on the declining number of renter households in this income bracket suggest otherwise. An absolute loss of low-income renter households, many of whom were rent burdened, suggest that declining affordability may have contributed to the displacement of these households to communities outside of Cook County.
Despite a decline in overall rent burden, half of all renter households in Cook County (49.9 percent of renters in Chicago and 50.3 percent of renters in suburban Cook County) and the vast majority of lower-income households continue to be rent burdened in 2017. In 2017, 81 percent of households earning between 30 and 50 percent AMI and 87.8 percent of households earning less than 30 percent AMI were rent-burdened. A large percentage of households earning less than 30 percent AMI are categorized as severely rent-burdened with 74.8 percent paying more than 50 percent of their income on rent. These figures have held relatively steady since 2012.
KEY TRENDS IMPACTING AFFORDABILITY IN THE CITY OF CHICAGO
While insufficient levels of quality, affordable housing in the City of Chicago have long been an issue for community development stakeholders and residents, concerns about the impact of lost affordable housing on population trends, neighborhood diversity, and economic opportunity have intensified as the city emerges from the housing market downturn and recession. IHS research has documented how the housing market recovery has left Chicago neighborhoods grappling with very different types of neighborhood change and how in some communities, increased demand for housing may threaten neighborhood affordability and leave lower-income residents increasingly financially vulnerable or at risk for displacement.
This section examines the nature of changing affordability in the City of Chicago, with a focus on changes since 2012. It highlights how a declining supply of affordable units is driving the affordability gap in the City of Chicago, how this has impacted lower-income households, and how these dynamics play out in submarkets across the City.
A sharply declining affordable supply is behind the City of Chicago’s affordability gap
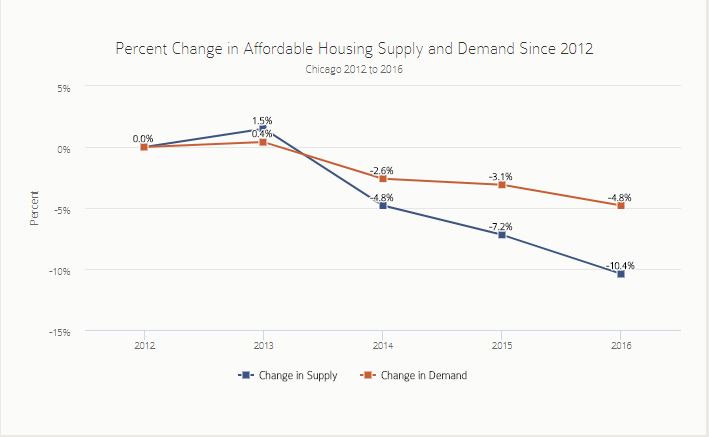
Different factors shape the affordability gap in the City of Chicago and in the suburbs, as last year’s State of Rental Housing in Cook County report showed. In Chicago, the declining supply of affordable units led to a growing affordability gap, despite declines in overall demand for affordable units. The chart below shows the longer-term trend for the supply of affordable rental units relative to demand in the City of Chicago indexed to values in 2012. It shows that while both demand for affordable units and the supply of units affordable to lower-income households have been declining since 2013, the pace of declining supply is faster than declining demand.
Since 2012, demand for affordable units has declined by 8.9 percent while the supply of affordable units has declined by 15 percent. While examining the composition of the lost affordable supply is not possible given data limitations, it is likely that the declining stock of two-to-four unit rental buildings in Cook County, noted above and highlighted by IHS research used to inform the City of Chicago’s 5-Year Housing Plan, is a key contributor to this trend.
Four submarkets on Chicago's north and northwest side saw the largest declines in affordability.
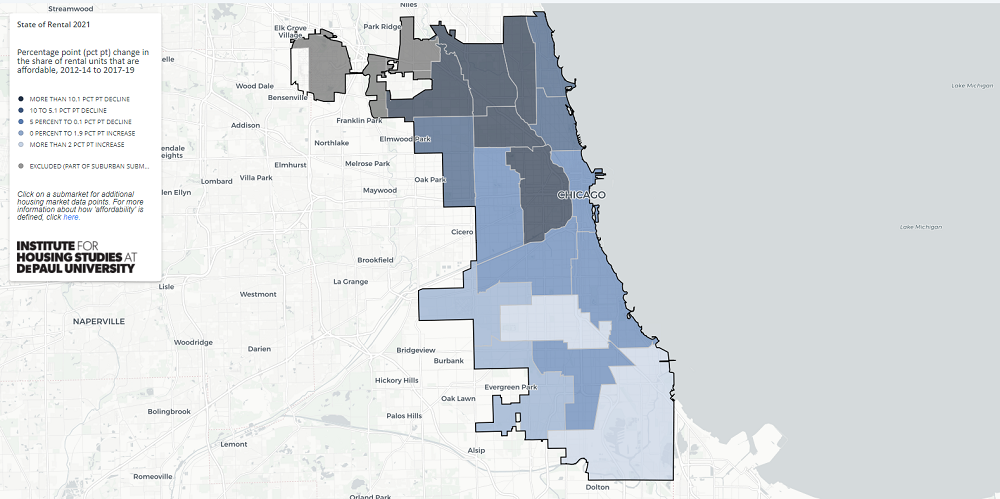
Using new data on average annual changes in affordable supply, the map below illustrates how the supply of affordable units changed between 2012-2014 and 2015-2017 across Chicago. A three-year average was created to account for small annual sample sizes at the submarket level. The map shows that during this period, areas with the biggest drops in affordable supply are north and northwest side communities where declining affordability has been a concern. These areas include Portage Park/Jefferson Park, where the share of units that were affordable declined by 13.1 percentage points between 2012-2014 and 2015-2017 and Logan Square/Avondale which experienced a 12 percentage point decline in the affordable rental share during this period. Similarly, Irving Park/Albany Park and Lincoln Square/North Center experienced a 10.9 and a 10.7 percentage point decline in the share of units that are affordable to lower-income households, respectively. For comparison, the share of the rental stock that was affordable to lower-income households earning 150 percent of poverty declined by just 4.9 percentage points in the City of Chicago during this same period. An affordable rental unit can be lost either through rent increasing to unaffordable levels, conversion to non-rental housing, or by demolition.
As of 2015-2017, each of the north and northwest side submarkets with the largest change in the share of affordable units had between 21.9 percent and 35.7 percent of the rental stock in affordable units. By comparison, 40.4 percent of the rental units in the City of Chicago were considered to be affordable in 2015-2017. Click on each submarket to view the share of rental units that were affordable in 2015-2017 as well as the change in the share of rental units that were affordable between 2012-2014 and 2015-2017. More information on the methodology for calculating three-year averages can be found here. Data for submarkets can be found in the appendix.
The affordable supply is shrinking - leaving many of the city's lower-income renter households in increasingly tenuous housing situations.
The chart and interactive table below examine the shifting dynamics of IHS’s affordability calculation for the City of Chicago and for 17 Chicago submarkets. The chart breaks out changes in 1) the share of occupied rental units that are affordable to lower-income households earning 150 percent of poverty, 2) the share of renters that are lower-income, and 3) the share of lower-income renters living in unaffordable units between 2012-2014 and 2015-2017. The interactive table includes these same data at the submarket level, as well as data on current conditions in 2015-2017.
At the same time as the city has been losing affordable rental supply, it has also been losing lower-income renters. The share of renters in Chicago that are lower-income declined by 2.7 percentage points between 2012-2014 and 2015-2017. While some of this loss may be attributed to economic improvement and renters earning higher incomes, it is also likely that some of this loss is due to lower-income renters leaving the city. Additionally, the growing share of lower-income renters in higher-priced units raises concerns that these households are increasingly housing insecure. During this period, the share of lower-income households living in unaffordable units increased by 4.1 percentage points, indicating potentially increased affordability pressure.
The interactive table below shows how the relationship between declining affordability, the loss of lower-income renters, and increasing affordability pressure on remaining lower-income renters plays out in submarkets across the city. Between 2012-2014 and 2015-2017, 13 of 17 submarkets in the city saw declines in the share of rental units considered affordable. As described above, areas on the north and northwest sides of Chicago saw the biggest losses in the share of rental units considered affordable. Over this same period, many of the same communities losing affordable supply are also seeing declines in the share of total renter households that are lower-income: 12 of 13 submarkets with a declining share of affordable units also lost lower-income renters during this period. Finally, for 13 submarkets, the share of remaining lower-income renters that living in unaffordable units increased.
Gage Park/West Lawn and Logan Square/Avondale led the city with the greatest declines in the share of lower-income renters during this period, although conditions contributing to these declines are likely different. For example, the majority of renter households in Gage Park/West Lawn were still lower-income in 2015-2017, whereas 38.9 percent of the renters were lower-income in Logan Square/Avondale, a 9 percentage point decline. Additionally, relative affordability increased for lower-income renters in Gage Park/West Lawn between 2012-2014 and 2015-2017 while affordability decreased for lower-income renters in Logan Square/Avondale. In 2015-2017, 49.1 percent of lower-income renters in Logan Square/Avondale were living in unaffordable units, an increase of 6.9 percentage points from 2012-2014. Conversely, in Gage Park/West Lawn, 39.3 percent of lower-income renters were in unaffordable units in 2015-2017, a decrease of 6.4 percentage points from 2012-2014.
Not surprisingly, Loop and Surrounding and Lincoln Square/North Center were submarkets with some of the lowest shares of affordable rental units in the city - 68.5 and 63.6 percent of the lower-income renter households lived in higher-cost units. These areas also saw the largest increases in the share of lower-income renter households in unaffordable units between 2012-2014 and 2015-2017. The share of lower-income renters in unaffordable units increased in these submarkets by 14.7 and 14.6 percentage points, respectively.