In the wake of the housing crisis, the need for a sufficient supply of quality, affordable, and stable rental housing has become increasingly important. The newest release of The State of Rental Housing in Cook County examines shifting patterns of renter and owner occupancy in Cook County from 2000 to 2011 with a focus on the period from 2007 to 2011. It looks at shifts in rental demand in Cook County, the changing nature of the supply of rental housing, and how these dynamics are impacting access to affordable rental housing for the lowest-income households.
The 28-page report available here as a PDF, includes more than 10 charts, a map highlighting the Cook County submarkets with the largest mismatches between the supply of and the demand for affordable rental housing, and complete data tables.
Key findings from the full report include:
- In the last decade Cook County saw dramatic shifts in the levels of renter- and owner-occupied households. Between 2000 and 2007, the level of renter households in Cook County declined from roughly 42 percent in 2000 to a low point of less than 38 percent in 2007. These trends reversed with the collapse of the housing market, a rise in foreclosures, and declining demand for homeownership. As Figure 1 shows, after 2007, more Cook County households became renters, and by 2011, rental rates had returned to 2000 levels.
 Figure 1. Change in Households that are Renter o r Owner Occupied in Cook County, 2000 - 2011
 - Both the City of Chicago and suburban Cook County saw growth in renter households and declines in owner-occupied households. Between 2007 and 2011, the number of renter households in the City of Chicago increased by 10.3 percent, while the number of owner-occupied households decreased by 11.6 percent. In suburban Cook County, the number of renter-occupied households increased by 11 percent, while the number of owner-occupied households decreased by 5.9 percent.
- Patterns of changing demand for owner- and renter-occupied housing have substantial geographic variation within the City of Chicago and suburban Cook County. In most submarkets, declines in owner-occupied households were offset, at least in part, by increases in renter households. Strong submarkets that experienced overall growth in households emerged, as well as weaker submarkets, heavily impacted by the foreclosure crisis, that saw declines in both owner-occupied and renter-occupied households. See the full report for a map of Cook County showing submarkets with the greatest mismatch between supply of and demand for affordable housing.
- Increases in lower-income renters largely drove the growth in renter households. Figure 2 shows that in the City of Chicago, renters making less than 50 percent of the area median income (AMI) accounted for 36,000 or nearly 70 percent of the increase in renter households between 2007 and 2011. In suburban Cook County, renters making less than 50 percent of AMI accounted for 27,000 or nearly all new renter households, also shown in Figure 2.
 Figure 2. Change in Renter-Occupied Households by Income Level, 2007 - 2011
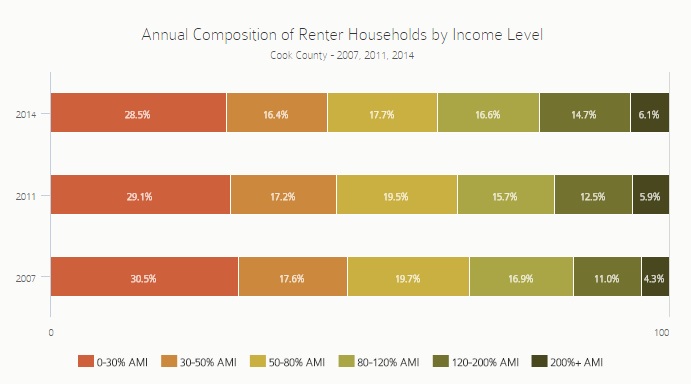
 - The majority of renter households made less than 50 percent of the area median income. Countywide, just over 56 percent of renter households earned 50 percent or less of area median income in 2011. In the City of Chicago, this number was slightly higher with nearly 58 percent of renters making less than 50 percent of AMI. In suburban Cook County, 53 percent of renters earned less than 50 percent of AMI.
- Between 2007 and 2011, the share of young renter households increased faster than any other age group. Over 68 percent of householders 25 to 34 were renters in 2011, an increase of nearly 10 percentage points from levels seen in 2007. Households in all age groups experienced a shift towards rental during this period.
- The number of single family rental homes in Cook County grew substantially. To meet the demand of the growing number of rental households, the supply of rental housing also increased. The increase in rental units was largely driven by growth in the number of single family homes being used as rental properties. Between 2007 and 2011, the number of single family rental properties increased by more than 21 percent in the City and nearly 30 percent in suburban Cook County.
- Despite growth in single family rental properties, the largest share of the County’s rental housing stock continues to be in multi-unit buildings. In the City of Chicago, units in two-to-four unit buildings represented roughly 40 percent of the total rental stock in 2011. In suburban Cook County, two-to-four unit buildings made up a smaller share of the rental stock, just over 20 percent. In suburban Cook County, the largest contribution to the rental stock in 2011 came from 5-to-49 unit buildings, which accounted for 45 percent of suburban rental units. Single family homes accounted for 23 percent of rental units in suburban Cook County.
- Median household income for renters declined in Cook County, but median monthly rent remained at the same levels. In Cook County, renter-household income declined while rents largely remained flat between 2007 and 2011. This shift was greatest in suburban Cook County, where renter incomes declined 10 percent between 2007 and 2011 while rents declined by only 1.6 percent.
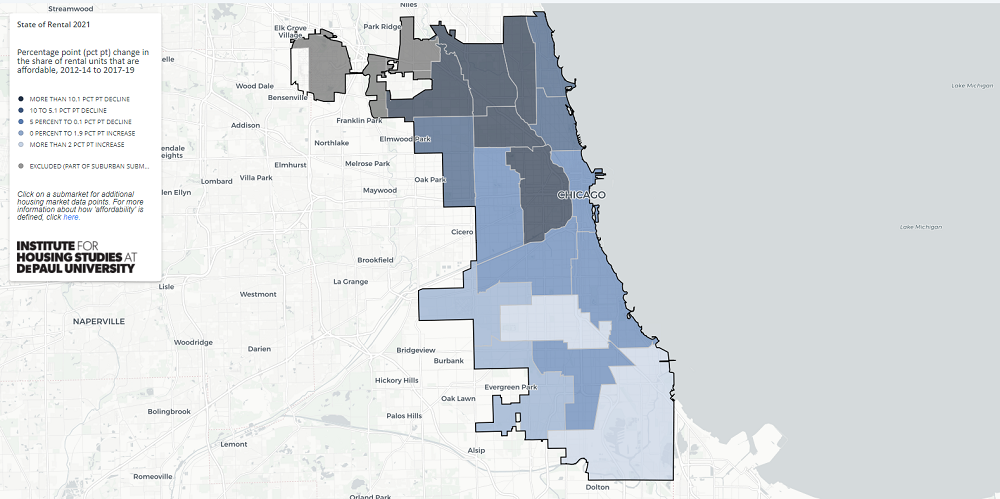
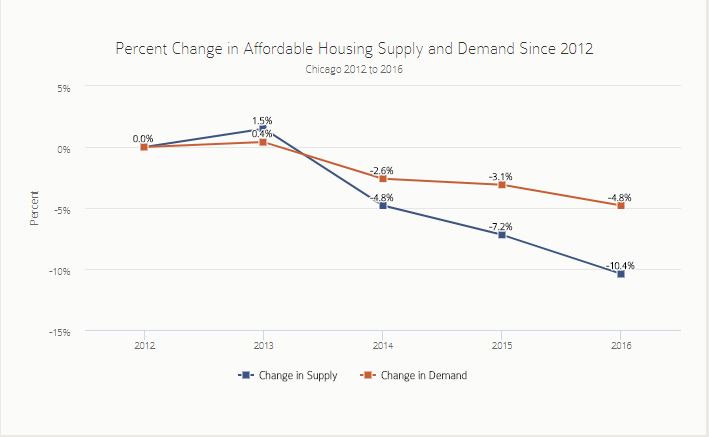
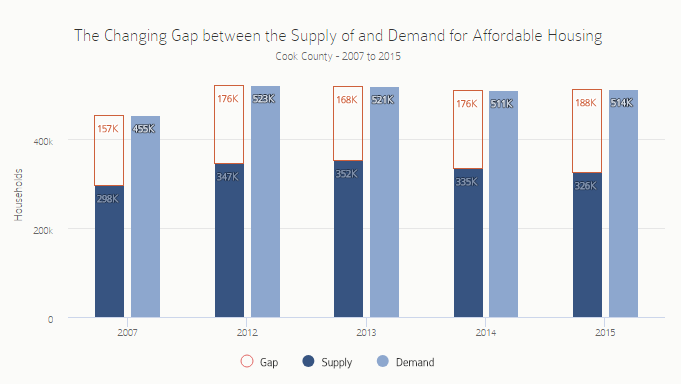
- The supply of rental housing affordable to lower-income households did not keep pace with the growing number of lower-income renters in Cook County. As shown in Figure 3 below, between 2007 and 2011, the supply of affordable rental housing remained stable or in some cases increased, but the demand for affordable rental outpaced any growth in the supply both in the City of Chicago and in suburban Cook County. Between 2007 and 2011, the gap between the supply of and demand for affordable rental housing in the City of Chicago increased by eight percent. In suburban Cook County this affordability gap increased by over 25 percent during the same period.
 Figure 2. Change in Renter-Occupied Households by Income Level, 2007 - 2011
 - The mismatch between the demand for and supply of affordable rental housing is greatest in north suburban Cook County. Areas in Cook County with the largest affordability gaps included submarket areas around Evanston and Skokie in north Cook County and areas near Palatine and Hoffman Estates and Schaumburg and Streamwood in northwest Cook County. In each area in 2011, the existing supply of affordable units met less than 50 percent of the demand for affordable rental.
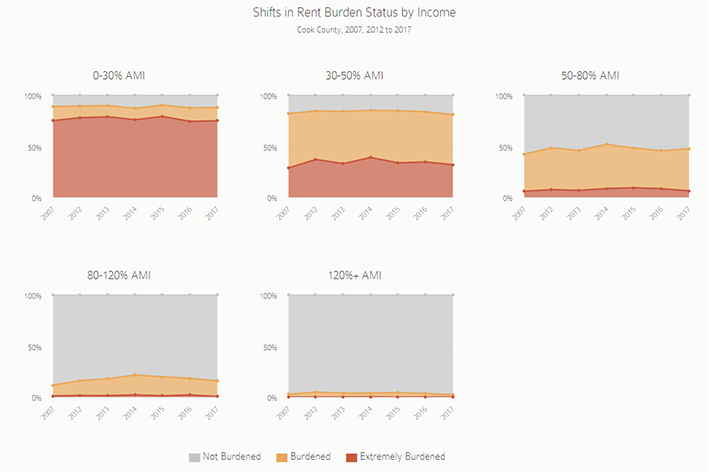
- There was an increase in rent-burdened households across all income groups. The mismatch between the supply of and demand for affordable rental housing means that more lower-income renters are paying a higher share of their monthly incomes toward rent.In Cook County between 2007 and 2011, the number of rent burdened households increased by nearly 14 percent and the number increased across all income categories.
Download and read the full report and check our blog for related updates and coverage.