Photo: Evelyn Ryan
This report examines the nature of changing rental housing affordability in the City of Chicago and the variation between Chicago submarkets where renters are likely facing greater affordability pressures. It highlights 1) the longer-term decline in the affordable supply since 2012 as of the early pandemic period in 2021, 2) how this has affected lower-income renter households, and 3) how these dynamics play out in submarkets across the city.
This report is a modified version of IHS’s bi-annual State of Rental Housing in Cook County report, focusing only on trends in the City of Chicago. IHS analysis has found that trends in the city and suburbs have increasingly diverged, and future State of Rental Housing Reports will also focus on citywide trends. However, data for Suburban Cook County and the county at large will continue to be available in a downloadable appendix.
The goal of the bi-annual State of Rental Housing in Chicago report is to help city leaders, affordable housing developers, and advocates understand evolving market conditions to better prioritize affordable housing investments and develop tailored strategies and solutions to meet affordability challenges in different submarkets. These strategies may include maintaining and investing in existing lower-cost rental housing to improve the quality of the stock, increasing efforts to preserve the affordability of the lower-cost rental stock in neighborhoods experiencing rising rents and housing market pressures, or building new affordable housing in neighborhoods with limited existing affordability.
The report uses the most recent data available from the American Community Survey to explore how longer-term trends in conditions have evolved throughout the post-Great Recession recovery period starting in 2012 through the first years of the COVID-19 pandemic up to 2021. Due to the experimental nature of the data, data from 2020 are not included in this analysis. The report uses data from 2019 to situate pre-pandemic conditions and provide some indication of how these conditions may have changed during the pandemic. However, given the substantial disruption caused by the pandemic on local housing and economic conditions, significant levels of short-term government interventions, and the still-evolving recovery, any short-term trends in the data should be interpreted cautiously. As more data become available in the coming years, it will be clearer if trends between 2019 and 2021 were short-term pandemic-related changes or the beginning of longer-term shifts in affordable rental housing needs.
For information on data sources and methodology, click here. To access the data behind the figures in the report, click here.
BACKGROUND
The housing market has changed considerably since the onset of the COVID-19 pandemic in early 2020. While the national economy has recovered significantly from a period of uncertainty and high unemployment, housing costs are still a pressing issue. Cost burdens for both renters and homeowners have continued to rise, reversing years of pre-pandemic cost-of-living improvements. These struggles reflect broader economic factors, such as inflation, as well as housing market characteristics that are affecting the supply of affordable rental units.
As households struggle with financial burdens, demand for affordable housing is high. While notably-low interest rates enabled some renters to transition to homeownership during the pandemic, many renters are still grappling with rent hikes and other financial burdens. Low-income renters, especially those in communities of color, have experienced the highest levels of financial distress, especially as state interventions, such as eviction moratoriums, have expired.
But Chicago’s supply of affordable units is also under threat as rents rise and previously-affordable units become unattainable to low-income renters. As existing owners sell their properties, there are concerns that new investors will raise rents in neighborhoods that are currently affordable. There are additional concerns that small-scale landlords, who own a large amount of the city’s supply of unsubsidized affordable housing, may raise rents as they struggle with the cost of repairs and rising property taxes. Further, Chicago’s supply of rentals in 2 to 4 unit buildings is dropping, threatening a key source of rental housing affordability. Rising rents without corresponding wage increases have left lower-income renters with less residual income than ever before, heightening cost burdens.
Previous IHS State of Rental Housing reports have analyzed Cook County’s gap between supply and demand for affordable rental housing. In the pre-pandemic market, the gap was slowly closing. However, rent increases, losses in the affordable supply, and limited new affordable rental construction have widened the gap considerably. While there has been a national surge in rental construction following the early pandemic lull, almost all of these new units have been concentrated in the upper end of the market. This stagnation of new affordable rental units, combined with the continued loss of existing affordable rentals in 2 to 4 unit buildings, has exacerbated the affordable rental shortage in Cook County.
TRENDS IN RENTAL DEMAND IN THE CITY OF CHICAGO
Understanding the demographic and economic characteristics of renter households in Chicago can help practitioners and policymakers better understand trends in rental demand, prioritize needs, and develop targeted strategies to stabilize vulnerable households and neighborhoods.
Previous IHS reports have highlighted the growth in demand for rental housing in Cook County during the years following the Great Recession. In Chicago, the rental rate has remained fairly stable since 2012, with between 54 and 58 percent of Chicago households renting during this period. In 2021, 54.2 percent of Chicago households rented, a slight decline from pre-pandemic levels and the lowest level since 2012. Despite this relatively stable level of overall rental demand, the changing relationship between the characteristics of renters and the housing supply has created affordability challenges, particularly in certain submarkets.
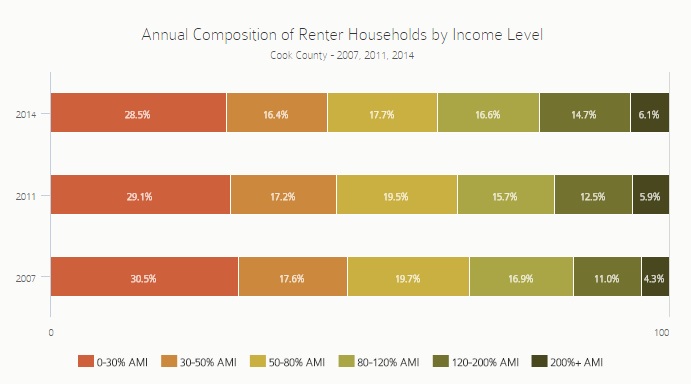
The share of Chicago renters that are lower-income declined over the past decade, but the share of very low-income renters increased during the pandemic.
Figure 1 shows that between 2012 and 2021, the share of Chicago renters earning less than 80 percent of the area median income (AMI) declined, and the largest drop occurred for renters earning less than 30 percent of the AMI. While these very low-income renters still account for the largest share of Chicago renter households, they accounted for just over 30 percent of Chicago renters in 2021, down from 33 percent in 2012. At the same time, the share of Chicago renters earning more than 80 percent of the AMI increased, with the largest increases for renters earning 80 to 120 percent of the AMI.
During the pandemic, there was a slight shift in this trend: The share of Chicago renters earning less than 30 percent of the AMI increased between 2019 and 2021, rising from roughly 28 percent to just over 30 percent. During this period there was a corresponding decline in the share of renter households earning between 30 and 50 percent of the AMI. It is likely that many of these renters dropped to a lower income level, which contributed to the increase in the number and share of very low-income households. While increased unemployment benefits, government stimulus packages, and enhanced protections for renters during the pandemic helped stabilize lower-wage workers impacted by the COVID economy, general economic insecurity for lower-income households is likely one of the main drivers of this trend.
Underlying data for report figures and data for Suburban Cook County and Cook County at large can be found in the report appendix.
Figure 1. Annual Composition of Renter Households by Income in the City of Chicago, 2012-2019, 2021
Over the past decade, the growth in older renter households has been one of the city’s leading trends, but this growth slowed during the pandemic.
One of the most significant national and local housing trends has been the recent growth in older renter households. As discussed in previous IHS research, between 2012 and 2019, the number of older (aged 65+) renter households in the city increased by 44.1 percent, and this growth was led by increases in the number of older Black and Latino renters. Figure 2 showcases that growth and also indicates that between 2012 and 2019, the share of Chicago renter households headed by an older adult increased from 12.1 percent to 16.7 percent. During the pandemic, however, this trend slowed. Between 2019 and 2021, the share of older Chicago renters decreased slightly, although the numbers are still at levels well above 2012. Reasons behind this shift are likely multifaceted and could be related to higher COVID-19-related mortality rates for both lower-income households and older adults, older adult renters moving in with family during the pandemic, or older adult renters moving to owner-occupied housing or rental housing outside of the city.
Figure 2. Annual Composition of Renters by Age of Householder in the City of Chicago, 2012-2019, 2021
TRENDS IN RENTAL SUPPLY IN THE CITY OF CHICAGO
Trends for Chicago’s changing rental supply can inform targeted solutions to close the city’s longstanding affordable housing shortage. Contextualizing the ways that current housing challenges compound existing longer-term affordability trends can inform policy development and program design.
Chicago’s rental housing stock continues to see a shift away from units in smaller buildings and towards units in larger buildings.
A substantial body of IHS research has highlighted the ongoing loss of 2 to 4 unit buildings in Chicago and the implications of this trend for the city’s supply of unsubsidized, lower-cost rental housing. As illustrated by Figure 3, rental units in 2 to 4 unit buildings remain the most common type of rental housing in Chicago, but the share of the city’s rental units in these buildings continues to decline. In 2012, rental units in 2 to 4 unit buildings made up just over 38 percent of Chicago’s rental stock, but this number declined by almost six percentage points to just over 32 percent by 2021—a ten-year low. Over the same time, the share of Chicago’s rental units in larger multifamily buildings increased, particularly in buildings with over 50 units. This shift represents one of the key affordable housing supply challenges facing the city as 2 to 4 unit buildings are the backbone of Chicago’s unsubsidized affordable housing supply while units in new construction, larger multifamily properties are much less likely to be affordable.
Underlying data for report figures and data for Suburban Cook County and the county at large can be found in the report appendix.
Figure 3. Distribution of the Rental Supply by Building Type in the City of Chicago, 2012-2019, 2021
TRENDS IN RENTAL AFFORDABILITY IN THE CITY OF CHICAGO
Trends in rental housing affordability in Chicago can inform how different demand- and supply-related policies and strategies can close the region’s longstanding affordability gap and reduce housing cost burdens for the city’s renters.
In every State of Rental Housing report, IHS documents the mismatch between the number of households that need affordable rental housing and the number of units that are currently affordable. This “affordability gap” is calculated by comparing the demand for rental housing by lower-income households earning 150 percent of the Federal Poverty Level ($41,610 in 2021) and the supply of units that would be affordable at 30 percent of a lower-income household’s income (about $1,040 per month in 2021). Affordable demand also includes renter households who earn more than 150 percent of the poverty level but live in units that are affordable to lower-income households.
The affordability gap is useful as a broad indicator to highlight the mismatch between the supply of and demand for affordable rental housing countywide and documents the scope of affordable housing needs. However, the affordability gap does not necessarily translate directly to the number of units that need to be built to solve the region’s affordability challenges. Instead, a range of policy interventions are needed to address this issue. These strategies may include increased access to voucher-based subsidies, new construction of affordable units in stronger markets, and different innovative solutions that preserve existing affordable units in neighborhoods with shrinking affordable supply, among others.
In Chicago, substantial declines in the affordable supply have led to the highest affordability gap in at least a decade.
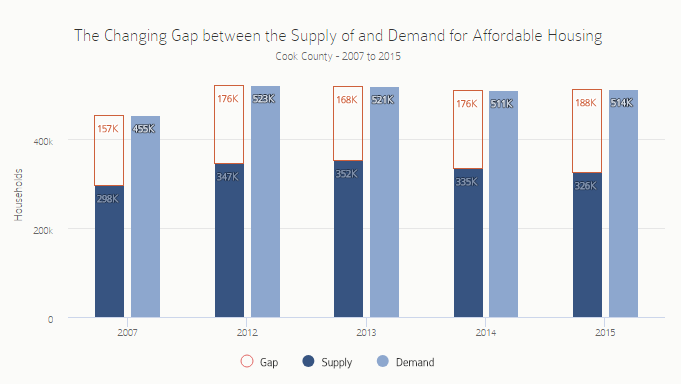
Figure 4 below illustrates the annual number of rental units that are affordable to households that earn 150 percent of the poverty level (supply) and compares it to the number of households that earn 150 percent of poverty or already live in rental units affordable to these lower-income households regardless of their income (demand). The difference between these two numbers is the affordability gap. The data show that the affordability gap had dipped to a low of nearly 100,200 units in 2019 but increased substantially during the pandemic. In 2021, Chicago’s affordability gap reached a ten-year high of 119,435 units, just above previous peak levels in 2016.
Figure 5 illustrates that since 2012, changes in Chicago’s affordability gap have largely been driven by declines in the city’s supply of affordable units. Between 2017 and 2019, the gap narrowed as the supply of affordable units increased slightly and the number of lower-income renter households continued to decline. However, during the pandemic, the affordable supply took heavy losses, likely due to rising rents. As the supply shrank, Chicago experienced a slight growth in lower-income renter households. As of 2021, Chicago has seen a roughly 15 percent decline in the affordable supply since 2012. Nearly 37 percent of this loss occurred between 2019 and 2021. Between 2019 and 2021, affordable demand increased by nearly 2 percent.
Underlying data for report figures and data for Suburban Cook County and the county at large can be found in the report appendix.
Figure 4. The Changing Gap Between the Supply of and Demand for Affordable Rental Housing in the City of Chicago, 2012-2019, 2021
Figure 5. Percent Change in the Affordable Rental Supply and Demand in the City of Chicago Since 2012, 2012-2019, 2021
As Chicago’s affordability gap grew, cost burdens increased for most renter households and the share of lower-income renters that experienced severe cost burdening grew substantially.
A cost-burdened household is defined as one that spends more than 30 percent of its income on housing. Between 2012 and 2019, the share of renter households that are cost-burdened in the City of Chicago steadily declined – dropping from 53.8 percent in 2012 to a low of 47.4 percent in 2019.
However, during the early pandemic period, the number and share of cost-burdened renters again grew, although remaining below levels observed in 2012. Figure 6 shows that in 2021, roughly 51 percent of City of Chicago renter households were cost-burdened, an increase of 3.6 percentage points from levels in 2019. The share of renter households that were cost-burdened increased the most for renter households earning 30 to 50 and 50 to 80 percent of the AMI, with increases of just over 9 and just over 10 percentage points between 2019 and 2021, respectively.
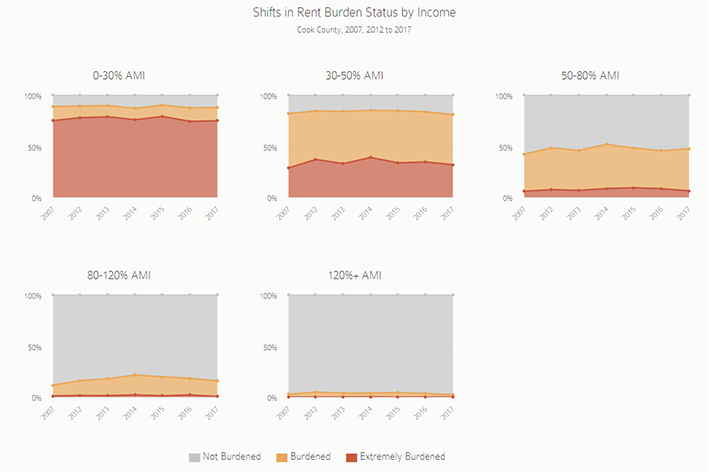
Figure 7 illustrates how cost burden shifts annually by the income level of the renter household and shows that nearly all households saw increased cost burdens during the early pandemic period. Cost burdening was not experienced evenly among all households, however. For the lowest-income renters, 88.6 percent of households were cost-burdened with the vast majority of these renters considered severely cost-burdened in 2021. Severe cost burdening refers to a household paying more than half of their income towards rent. Between 2019 and 2021, the share of very low-income renters that were severely cost-burdened increased by just over eight percentage points, from 66.7 percent of very low-income renters to 75 percent. For renters earning between 30 and 50 percent of the AMI, the increase was even larger, growing by 13.5 percentage points from nearly 23 percent to just over 36 percent.
Figure 6. Share of Renter Households that were Cost-Burdened in the City of Chicago, 2012-2019, 2021
Figure 7. Shifts in Rent Burdened Status by Income in the City of Chicago, 2012-2019, 2021
KEY TRENDS IMPACTING AFFORDABILITY IN THE CITY OF CHICAGO
Data on changing affordability levels in Chicago can help city leaders prioritize affordable housing investments and develop tailored strategies and solutions to meet affordability challenges in different submarkets. These strategies may include maintaining and investing in existing affordable rental housing in communities where it exists and expanding access to neighborhoods where affordable rentals are vulnerable to market pressures.
This section examines the nature of changing affordability in the City of Chicago and submarkets where renters are likely facing greater affordability pressures. It highlights the longer-term decline in the affordable supply since 2012 and during the early pandemic period, how this decline has impacted lower-income households, and how these dynamics play out in certain submarkets across the city. Given the relatively small sample size at the submarket level, this analysis calculates a three-year average for each submarket to limit any potential annual volatility in the data. Because of this, the analysis groups data from 2019 and 2021 and therefore is unable to isolate pandemic-specific trends at the submarket level. These data are included to highlight longer-term submarket-level trends.
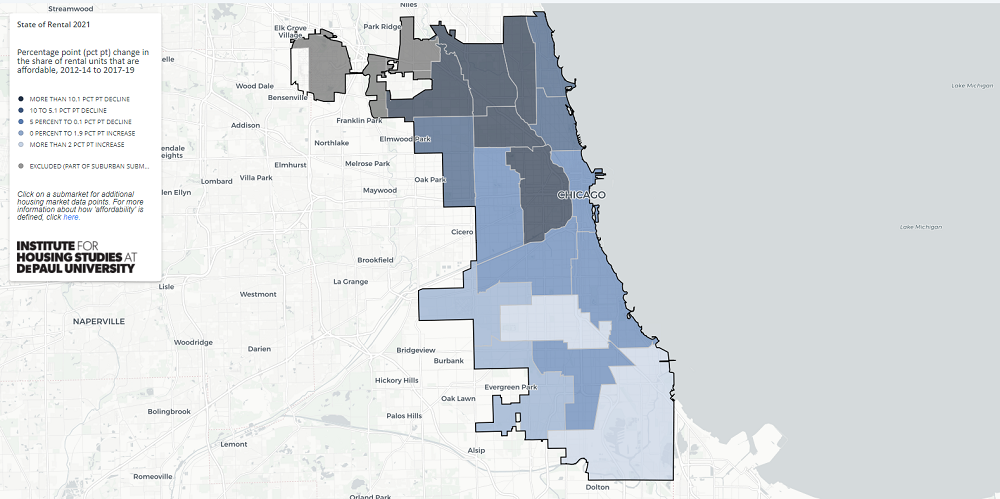
Submarkets on Chicago’s North and Northwest Sides continue to see the largest declines in rental affordability.
While nearly every submarket has seen longer-term losses in affordable supply, the interactive table below shows that North and Northwest Side submarkets continue to see the biggest declines. In 2021, 38.6 percent of Chicago’s rental units were affordable to lower-income households earning 150 percent of the Federal Poverty Level. Affordable supply varies greatly from one submarket to another, however. For example, in 2021, just under 16 percent of rental units were affordable in Lakeview/Lincoln Park while roughly 65 percent of rentals were affordable in Englewood/Greater Grand Crossing.
Averaging the share of affordable rentals from 2012-2014 to 2019-2021 reveals that the share of rental units that were affordable to lower-income renters in the City of Chicago declined by 6.7 percentage points. In certain submarkets, this loss was substantially higher, however. Affordable rental housing can be lost either through rent increasing to unaffordable levels, conversion of the rental unit to owner-occupied or non-residential uses, or deterioration and demolition. For example, Logan Square/Avondale recorded a 15.3 percentage point decline in affordable units during this period – from 40.4 percent of the stock in 2012-2014 to just 25 percent of the stock in 2019-2021. Other areas with large declines in the share of units affordable to lower-income households include West Town/Near West Side and Rogers Park/Uptown which saw their shares of units that were affordable decline by 14.6 and 12.5 percentage points, respectively.
Submarkets with the lowest levels of affordability also have some of the highest shares of lower-income households living in high-cost units. These submarkets include the Loop, Lincoln Square/North Center, Lakeview/Lincoln Park, Logan Square/Avondale, and Portage Park/Jefferson Park. These higher-cost submarkets have likely lost formerly affordable rentals to market pressures through rent increases and conversions to more expensive housing types such as condominiums and single-family homes. Submarkets in the South and West Sides have lower levels of lower-income renters living in unaffordable rentals compared to the North and Northwest Sides, but the numbers are still significant: roughly a third of lower-income renters in these communities live in unaffordable rentals.
The data show that nearly every submarket with increased affordability pressure has also seen a corresponding decline in the share of renter households that are lower-income. For example, between 2012-2014 and 2019-2021, the share of renter households that are lower-income in Logan Square/Avondale and West Town/Near West Side declined by 18.9 and 14 percentage points, respectively. During this same period, the share of lower-income households living in unaffordable units increased by 10.2 and 10.6 percentage points, respectively. This pattern suggests that the number of lower-income households living in unaffordable units would likely have been even greater if not for the general neighborhood loss of lower-income renters.
Figure 8. Shifting Dynamics of Affordable Supply and Lower-Income Demand in Chicago Submarkets
The map below illustrates the change of affordable units averaged between 2012-2014 and 2019-2021 across 17 Chicago submarkets. A three-year average was created to account for small annual sample sizes at the submarket level. To view a full-page map, click here. More information on the methodology for calculating three-year averages can be found here. Data for all submarkets in Cook County can be found in the report appendix.
Figure 9. Percentage Point Change in the Share of Rental Units that are Affordable in Chicago Submarkets, 2012-2014 to 2019-2021